
What the Elections Performance Index can — and can’t — tell us about Vote-By-Mail
As the continued spread and prevalence of COVID-19 threaten to make voting in-person dangerous for many Americans, the prospect of voters mailing in their ballots this November looks more and more likely. However, even though vote-by-mail (VBM) is so politically pertinent, there is a lot we don’t know about it. These unknowns are of great consequence.
Uncertainty surrounding VBM will impact voter preparedness come November, and has spurred wide debate over the implementation of vote-by-mail. This debate is worthwhile, but has included some inaccurate assertions being thrown around (for example: the assertion that VBM is inherently partisan).
Currently, only Washington, Colorado, Oregon, Utah, and Hawaii conduct their elections entirely by mail (though California will mail a ballot to every registered voter in 2020). In fact, Utah and Hawaii only implemented their all-VBM measures in 2019, meaning this election cycle is the first time these two states will run their elections under the new policy. Since a purely VBM system is restricted to these five states, and each state in the U.S. has a unique set of election policies, circumstances, and laws, it makes it difficult for political scientists to anticipate how other states would be affected if they implemented a fully VBM system this year. To make matters more complicated, the effects of vote-by-mail aren’t well studied even in states where all elections are done via mail.
This article will certainly not solve this problem, but will hopefully spread awareness about a tool that can help; something that could provide a quantitative representation of how states are doing managing elections. That way, we could compare states’ scores prior to starting VBM to after to try and glean some potential insights. But what tool could we possibly use?
Meet the Elections Performance Index. In this piece we’ll (re-)introduce you to the index, talk about its limitations, and look at some of the ways in which it is very useful.
What is the Elections Performance Index?
The Elections Performance Index (EPI) provides a non-partisan, objective measure of how well each state is faring in managing national elections. The EPI calculates this measure from seventeen indicators to provide a multi-faceted report card for each state’s performance in midterm and presidential elections since 2008.
The EPI is an incredibly useful tool, but it is not a crystal ball. Though it can help researchers broadly anticipate which states have struggled with election administration in the past and may struggle even more with the difficulties of voting in a pandemic, it cannot account for the specifics of the coronavirus and the ways it will impact levels of registration, turnout, and problems with VBM.
The limitations of data
Like all statistical indexes, the EPI is limited by the data at its disposal. Not every state shares complete data with the Election Administration and Voting Survey (EAVS),which is a key source of the data used to calculate the EPI, along with other sources that poll voters directly. In 2018, 24 states shared fully complete EAVS data, a slight decrease from 2016. Other states report varying levels of incomplete data.
Jack Williams, a Senior Research Associate at the MIT Election Lab working on the 2018 index, dug into data completeness in the EPI in a previous article. The visual below sums up some of his findings:
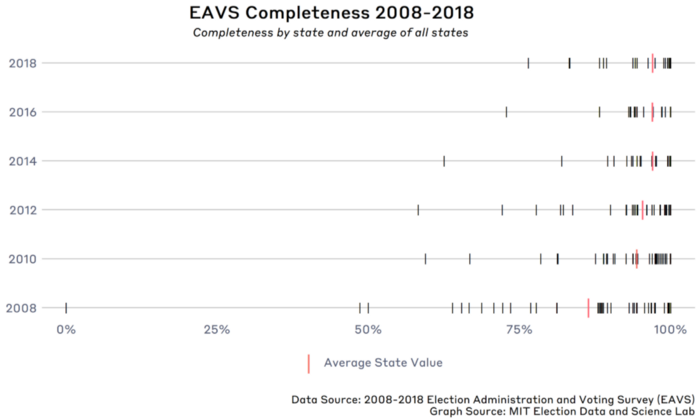
Looking at this, we can tell that the average level of data completeness over all states is on the rise, with a particularly substantial uptick between 2008 and 2010, although between 2014 and 2018 the differences become nearly imperceptible. The overall upward trend is good news, but holes in the dataset remain. States with incomplete data will be reflected less accurately in the index, which means assumptions driven from these estimates will necessarily be less accurate as well.
Despite these limitations, the EPI is a powerful tool. It measures a litany of indicators that run the gambit from time spent in line at the polls to problems voting due to a disability. Its provided scale makes it easy to track a state’s progress over time on certain issues and can facilitate between state comparisons. These measures are as good as the data that is provided, and though there are holes in the data, the majority of it is robust.
Data incompleteness addressed, let’s now turn to the question at hand: how does implementing vote-by-mail affect a state’s ability to manage their elections?
Let’s talk about indicators
Lucky for us, the index has many useful indicators directly related to mail-in-ballots, including the number of mail ballots rejected and unreturned (sourced from the EAVS, which relies on states to provide data), and registration and absentee ballot problems (sourced from the Census’s Current Population Survey’s Voting Rights Supplement, which polls voters on their experiences). These might seem like perfect indicators for us to use as we try and gauge the impact of mailing in our ballots on election day. However, all of these indicators (like any measurement) have limitations that need to be taken into account.
In a piece with the MIT Election Lab, Christopher Mann points out many of these limitations. Mann argues that the indicators mentioned above cannot be used in a vacuum to judge the administration of VBM. For example: a state that has instituted vote-by-mail is more likely to have problems with mail ballots than another state (and receive a worse score on that specific indicator in the EPI) precisely because it sends out far more mail ballots than other states that don’t have an all-VBM policy. In other words, the indicators are a good measure of which states have the most problems with mail-in ballots, but they don’t put these problems in context.
That means when analyzing the impact of VBM on state outcomes defined by the EPI, it’s actually best to steer away from a narrow look at mail ballots rejected, mail ballots unreturned, and registration and absentee ballot problems. When we analyze these indicators, it will be very important for us to put them in context, especially if we’re looking at them in relation to VBM.
In future pieces, I’ll take a look at some of these indicators and how the introduction of VBM changes (or doesn’t change) them. How will we begin to make such a comparison?
Analyzing states that use mail-in-ballots for all elections
Though the policy is far from the norm, VBM is not totally alien in the US; we already know that five states conduct all-VBM elections.
Utah and Hawaii are the newest participants in all-mail elections; both states made the policy jump in 2019. Oregon, on the other hand, has been conducting all of its elections by mail since 1998. Because the EPI provides information on elections from 2008 to 2016 (with a 2018 update about to launch), it can’t tell us anything about Hawaii and Utah yet. Results from Oregon won’t be very meaningful either, because the state has had VBM for the entire duration of the index. This means we can’t observe how the state’s change in policy to universal vote-by-mail affected its election administration performance based on the EPI indicators.
So when focusing on comparisons that can tell researchers about the effect of VBM, it is best to focus instead on Washington and Colorado. Washington transitioned to an all VBM system in 2011, and Colorado made the switch in 2013.
One more important thing to note about the limitations of our analysis before we move forward. When we compare EPI results from an election year before a policy change and an election year after that change, we are looking for a rough idea of the impact of that policy on the EPI indicators. Even though we restrict our analysis to Washington and Colorado to make sure we can compare “before VBM” cases to “after VBM” cases, our model suffers from selection bias. States and counties that opt-in to VBM might be systematically different than those who don’t, which means the effects of VBM in these locales might not be the effects generally.
To solve for this, in academic work, researchers hone in on an effect by constructing experiments, instituting control variables, or trying to find naturally occurring instances of random assignment. Since we are taking a broad look, rather than running an experiment, our findings should be taken with a grain of salt; they should help direct inquiry instead of putting an end to the question altogether.
Takeaways
We can use the EPI to examine the effects of vote-by-mail, but not on indicators that are specifically about mail-in-ballots.
The EPI indicators provide important information by presenting the absolute measure of a problem, but don’t put the data in context. If we made comparisons without paying attention to context, we might return from our analysis believing VBM is making Oregon much worse at the administration of mail ballots, when the truth is that Oregon simply processes many more mail ballots than other states. A small problem with mail ballots in any other state is amplified by the volume of mail in Oregon.
We have two really interesting case studies to consider in Colorado and Washington, but it’s important to note that these states didn’t select VBM randomly.
Any effects (or null effects) we observe are specific to these two states. There is significant value in that, but we need to be careful not to over-generalize these findings in our understanding of how VBM would work across the country. If we could randomly assign a certain number of states to adopt universal VBM, perhaps we could take a stab at answering that question. But in our current reality, we should avoid such empirically unsteady aims.
We need more data to make these comparisons effectively.
As we’ve already seen in the states that have adopted all-VBM policies, vote-by-mail may operate very differently depending on the state it is introduced in. Without reliable data over time that allow us to compare how states manage elections before, immediately after, and years following the implementation of VBM, we’ll continue to have a hazy picture of potential effects.
Up next: our analysis of the potential impact of VBM on EPI Indicators using the case studies of Colorado and Washington. Stay tuned!


