
The rate of registration applications that states reject is a salient feature of election administration, and analyzing how that rate differs among states is an important part of painting a comprehensive picture of the election process. As a general rule of thumb, a well-run election should have a low rate of voter registration rejections–and the 2022 Elections Performance Index brought good news in that regard (though there will likely always be some rejections due to a small portion of applicants being ineligible to register). However, taking a closer look will help us understand how this indicator is constructed, allow us to explore it in context, and understand the fuller story of why it matters as part of American election performance.
It’s not always clear why voter registrations are rejected, though some of the most common reasons include ineligible voters attempting to register, voters making mistakes in filling out their registration form, or voters filing duplicate registrations. A high registration rejection rate may be an indication to a state’s election officials that there is something that requires attention—functioning as a kind of “check engine” light for the system. For example, if a state is receiving a large number of duplicate registrations, it may be that voters are experiencing confusion over whether they have successfully registered, or how to do so. Regardless of why voter registrations are rejected, states with high rates of voter registration rejection are forced to dedicate their already limited resources to troubleshooting these rejections, which often leads to more provisional ballots cast, longer voting wait times, and other delays.
Registrations Rejected in 2022
According to the comprehensive report from the 2022 Election Administration and Voting Survey (EAVS), states reported rejecting 1,873,700 registration applications between the 2020 and 2022 general elections. This accounts for 2.5% of total registrations received nationwide, a percentage slightly lower than the rejection rates in 2020 (2.9%) and 2018 (3.4%). These numbers do not include duplicate registrations, which the EAVS calculates separately.
Data Calculation
We construct the Registrations Rejected indicator using data from the EAVS, which is conducted by the Election Assistance Commission (EAC) every other year following each federal election. The EAVS is an important source of in-depth data about how Americans vote and how US jurisdictions administer elections; one goal of collecting these data is to anticipate voting trends and inform critical resource investment decisions. The EAVS is a crucial and unique source of information that the EPI requires, and we have developed a multi-step process to ensure those data accurately reflect the landscape of election administration in the states. As part of this, we identify missing data and standardize anomalous information; more details about this process are available in our EPI methodology document.
Using the EAVS data, the EPI’s registrations rejected rate is calculated as follows:
Registration rejection rate = Invalid/rejected registrations/(Invalid/rejected) + (valid) registrations
The map below shows the registration rejection rate as a percent of the total registrations received during the 2022 midterms. Twelve states (California, Connecticut, Hawaii, Idaho, Illinois, Kansas, Oregon, South Carolina, Utah, Wisconsin, and Wyoming) had incomplete data for this indicator and are thus excluded. North Dakota is also omitted since it does not have voter registration.
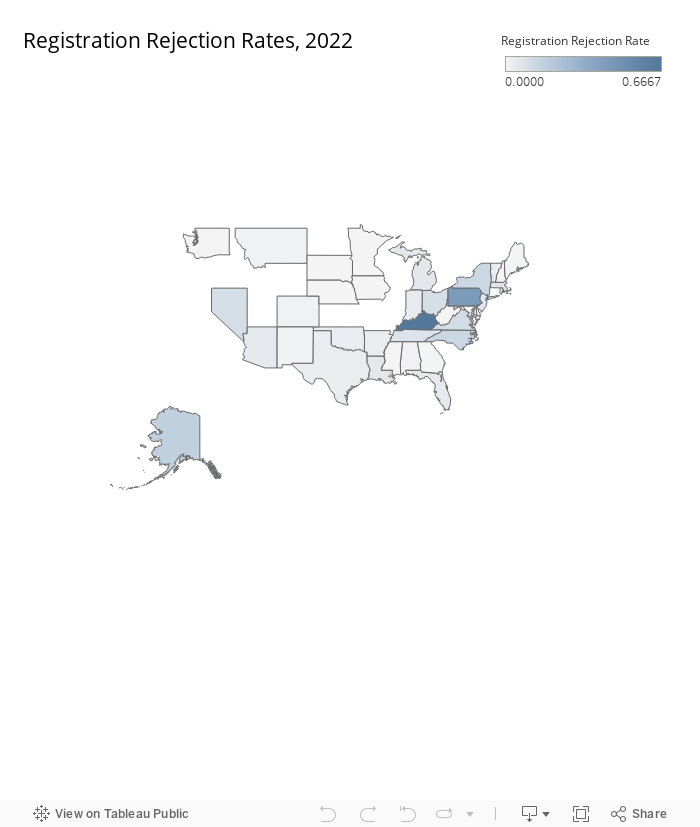
A map of the United States showing the rate of rejected voter registrations in 2022. Lighter colors indicate a lower rate and darker colors indicate a higher rate.
The values for this indicator vary widely, from 0% of registrations rejected in New Hampshire to 66.66% in Kentucky. The variation likely has to do with the different ways states calculate and report this indicator. To get a sense of the larger context, it’s important to expand our analysis slightly.
Changes Over Time
One of the strengths of the EPI is that it allows us to examine how states have changed over time, which the EPI easily allows us to do. The plot below compares the rate of registrations rejected in 2018 and 2022. States above the line had a higher rate of rejection in 2022 as compared with 2018; those below the line saw a lower rate of rejection in 2022. We can see that Kentucky and Pennsylvania appear to be outliers with higher rejection rates—as previously mentioned, this is likely due to changes in the way they measure this indicator from one year to the next. On average, the registration rejection rate decreased slightly in 2022, with an average of 6.39% nationwide compared to 8.02% in 2018.


So how do these changes over time factor into the EPI? Since the index allows us to compare states from one election cycle to the next, the EPI uses a standardized metric of zero to 100 to measure all of its indicators. A score of zero indicates that a state scored at the all-time minimum of the measure, while a score of 100 indicates that a state scored at the all-time maximum. In the case of registrations rejected, a lower score on this normalized scale translates to a higher rejection rate. The plot below shows how the states measure up when we normalize the registrations rejected indicator. The graph shows the standardized scores for 2018 and 2022; the states are listed according to how much they improved between the two elections.


Looking at the plot, we can see right away that several states have made significant improvements in the number of rejected registrations. Florida shows the most improvement, with a 6.44% decrease in the rejection rate. Tennessee, North Carolina, and Virginia follow close behind, with rejection rates between 5 and 6 percentage points. On the flip side, Alaska’s registration rate increased from 9.9% in 2018 to 16.74% in 2022; Michigan and New Jersey also experienced significant increases of 4.92% and 3.76%, respectively. Unfortunately, the EPI cannot tell us what accounts for changes in each indicator from year to year, though highlighting these patterns over time can act as a launch pad for future research.
Conclusion
Voter registration is a crucial part of the electoral process, and measuring the degree to which registrations are rejected can help paint a holistic picture of how this process operates in different states. From the 2022 EPI, we can see that the registration rejection rate nationwide has decreased from 2018, which indicates that election administration in this area is steadily improving. Running an election is a resource-intensive endeavor, and states with lower registration rejection rates gain more valuable time to ensure that other parts of the election administrative process run smoothly.


