
The Elections Performance Index (EPI) strives to provide a comprehensive, data-driven analysis of election administration across the United States. Many factors contribute to an individual state’s ability to administer elections smoothly, and having consistent, holistic reports on their performance is an important way to understand the features and results of states’ election apparatus. The EPI includes a data completeness indicator to measure the degree to which states provide information about their elections.
To create this indicator, we use the most comprehensive repository of these data: the Election Administration and Voting Survey (EAVS), published biennially by the Election Assistance Commission (EAC). The data completeness indicator is comprised of 18 survey items drawn from all portions of the EAVS: voter registration, military and overseas voting (UOCAVA), mail voting, in-person polling operations, provisional ballots, and voter participation and election technologies. The data completeness indicator measures the percentage of jurisdictions in each state that provided all 18 of these core statistics to the EAVS for any given year (for a full list, see our methodology document.) The EPI does not report on the exact metrics that are present or missing for any given state, just the total data completeness score.
Measuring Completeness
Unlike most other EPI indicators, data completeness can be compared across election types. The rate of completeness has remained relatively high over the last few election cycles; overall, the country has gone from an average completeness of 86% in 2008 to a record high of 97.98% in 2020. While the 2022 national average dropped slightly, the change was minimal: the nationwide average for data completeness in the midterm was 97.24%. The lowest score was only 80.36% (in Idaho), a significant improvement from earlier iterations of the index.
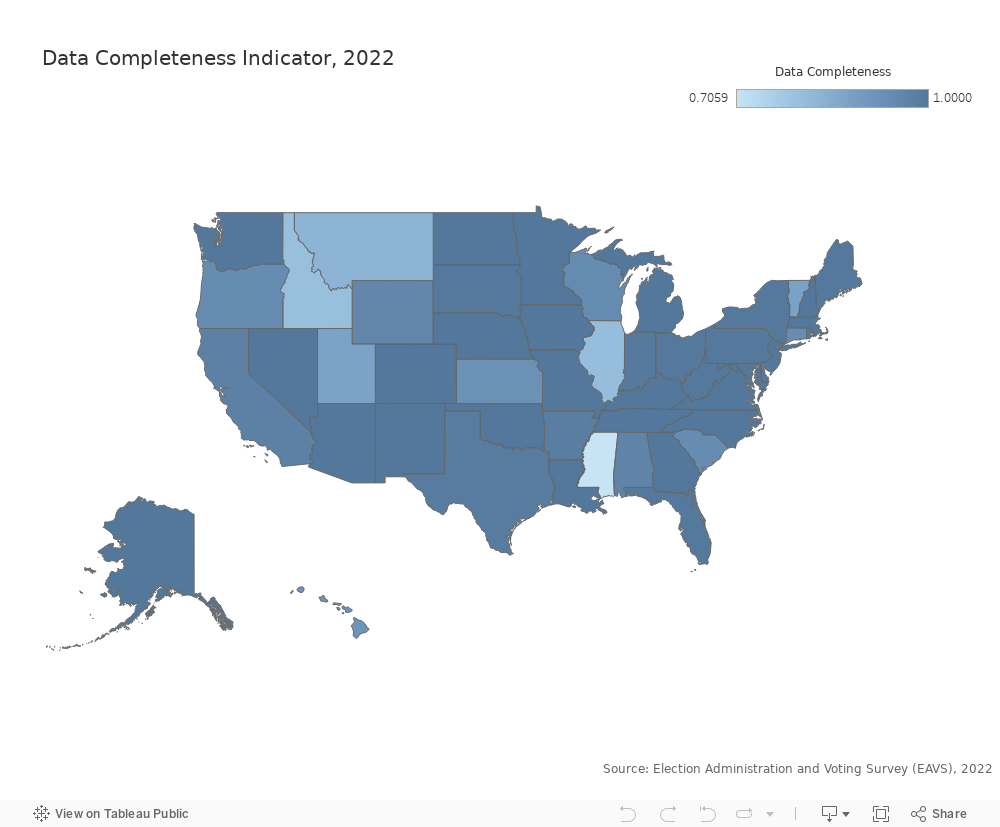
A map of the United States showing the distribution of the Data Completeness Indicator scores in 2022. Lighter colors indicate a lower rate and darker colors indicate a higher rate.
The high scores in 2022 can largely be attributed to a record-breaking number of states—twenty-six—achieving 100% completeness. The number of states hitting that mark has risen steadily since 2008, when only seven states achieved it. The plot below compares the percentage of data completeness for all states in 2018 and 2022, with states above the line having increased their completeness percentage since 2018 and those below the line seeing decreases in their completeness percentage.


As with all other EPI indicators, we use a standardized metric of zero to 100 to measure and display the data completeness indicator. A score of zero indicates that a state scored at the absolute minimum of the measure, while a score of 100 indicates that a state scored at the maximum. The plot below shows how the states measure up when we normalize the data completeness indicator in this way. It shows the standardized scores for 2018 and 2022, and the states are ordered according to how much they improved between the two elections.


As the plot shows, many states had 100% completeness in 2018 and 2020. Rhode Island showed the most dramatic improvement, increasing from 42% to 100% between midterm election years. Montana had the largest regression, declining from 100% data completeness in 2018 to 59% data completeness in 2022.
Conclusion
The EPI’s data completeness indicator is a useful metric for capturing the extent to which states collect election administration data and communicate it publicly via the EAVS, arguably the most holistic survey of the state of American elections. This information is crucial for academics, practitioners, and voters to understand the underbelly of elections in their state effectively. 2022 saw a record-breaking number of states with 100% completeness, and the number of states with scores significantly below that is minimal. Since many states have now set the precedent for full completion, this trend will hopefully continue.


