Exploring Voter Registration in 2018
A closer look at voter registration rates and how they factor into the upcoming 2018 Elections Performance Index.
The Elections Performance Index (EPI) seeks to measure how convenient and secure voting is in each of the fifty states. Because every state except North Dakota requires eligible residents to register before voting, it is natural to think of one measure of convenience being the registration rate — the number of people who are registered divided by the eligible population. The greater the registration rate, the greater the convenience.
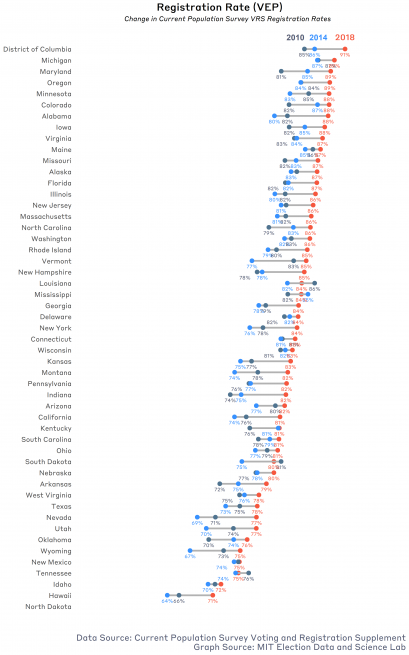
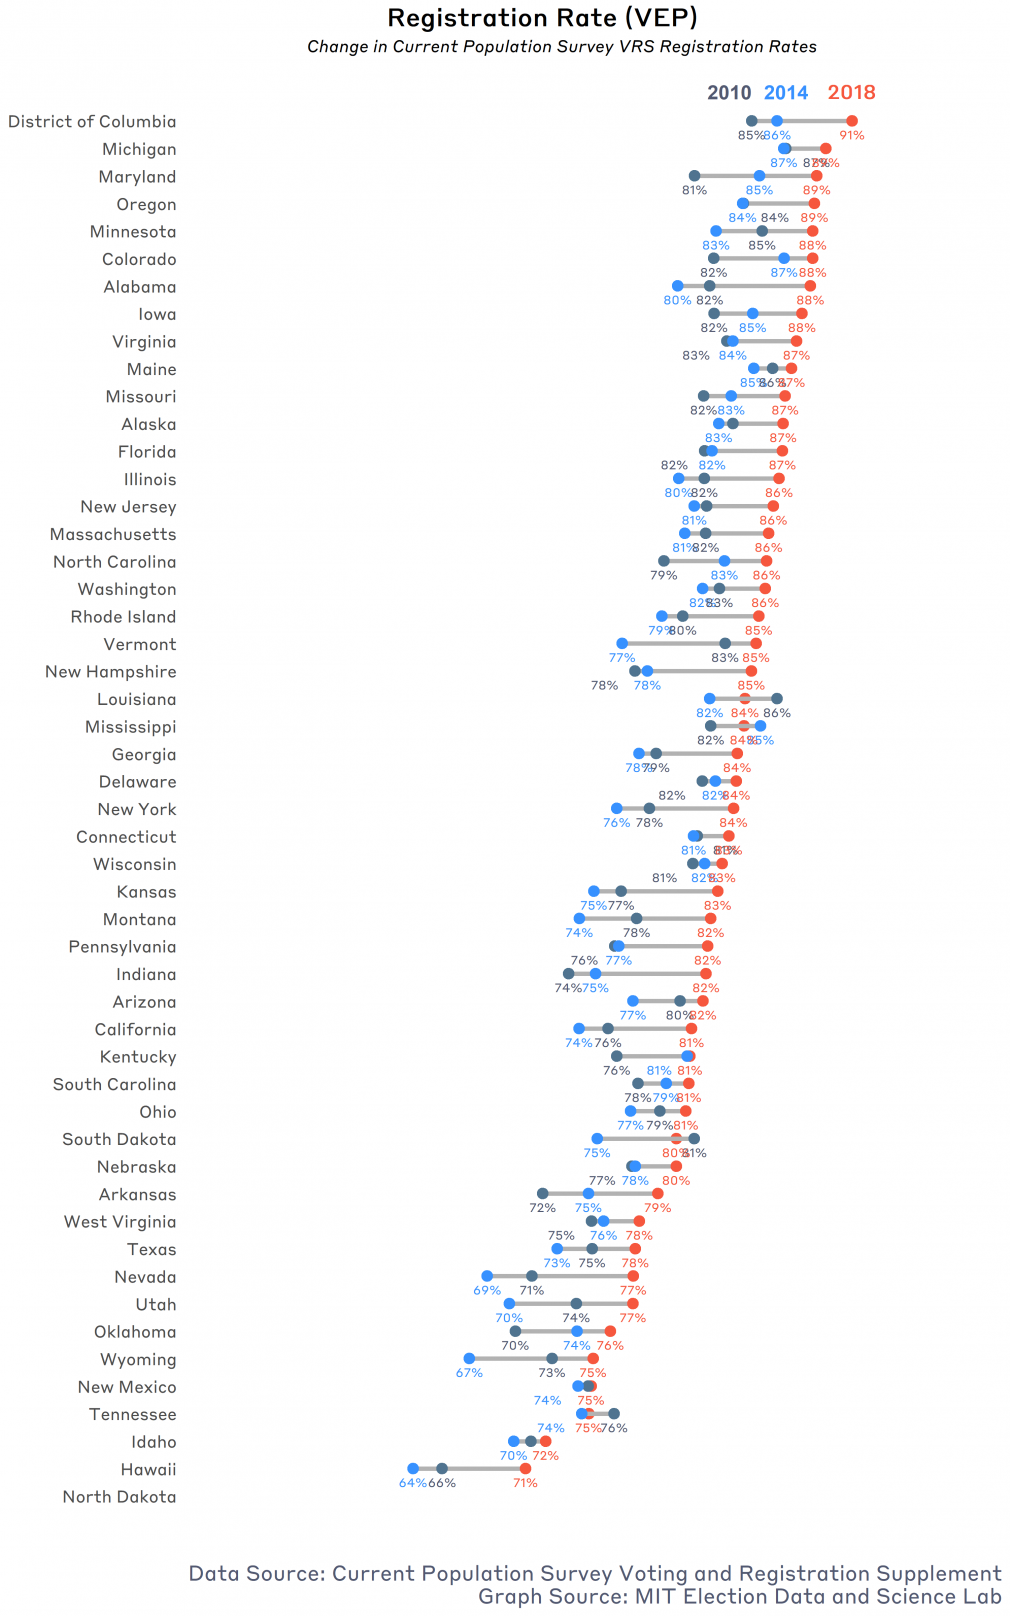
If we use the registration rate as one measure of convenience, then by this score, voting was more convenient in 2018 than in 2014.
As we discuss in the rest of this post, measuring the registration rate is actually more complicated than it would seem at first glance. We’ll take a detour further down in this post to examine why the EPI chooses not to use official registration statistics to measure the registration rate, and instead uses a survey-based estimate of the registration rate. After all, as we’ve written before, there are some important qualifiers to take into account when working with survey data.
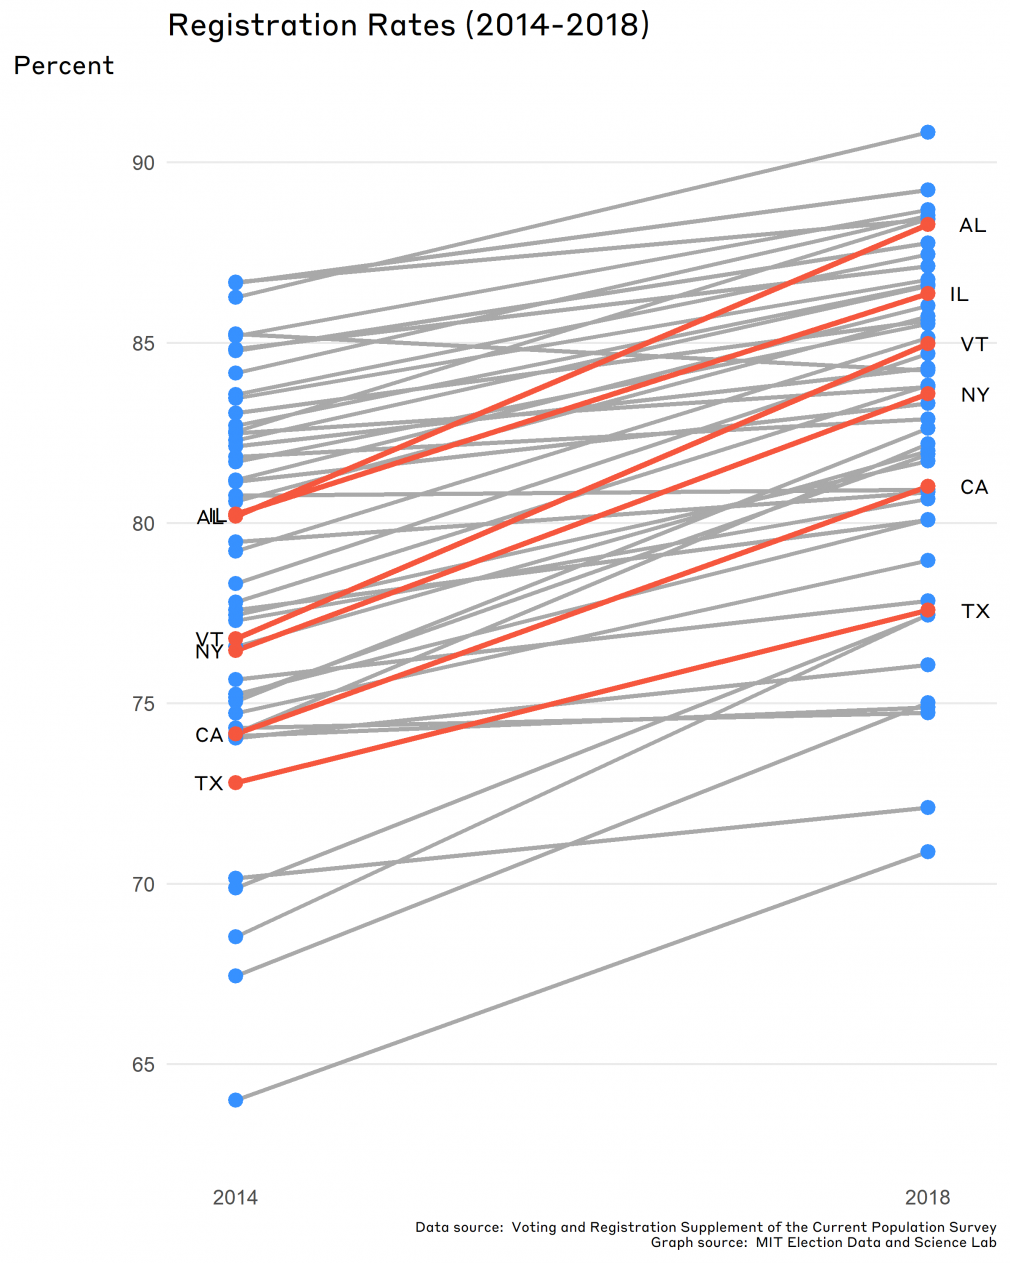
Still, by any measure, the registration rate nationwide went up in 2018 compared to 2014, the previous midterm election. If we use official registration data from the states — the unpreferred way to measure it — the 2018 nationwide registration rate was 90%, up from 84%. If we use data from the Current Population Survey — the preferred measure — it was 83%, up from 79%.
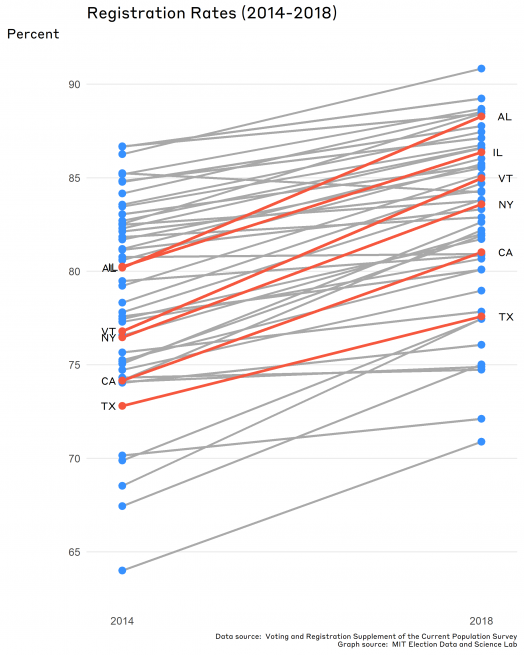
Overall, we see that states had an average increase of 4.2% in 2018 registration rates when compared with 2014. Six states saw significant increases in their registration, including California, Texas, and New York — the three most populous states in the country.
Why the EPI uses the CPS
The number of registered voters is not a static number. It is a constantly changing and updating list, subject to nearly year-round additions and subtractions. While it’s easy to verify and add new registrants, removing registered voters can only occur when those registrants move, die, or become otherwise ineligible (for example, because of a felony conviction or mental incapacitation). Removing these names from a voter registration list can be challenging. Someone moving, for example, is usually not immediately removed from the registration list. Even when election officials learn of a voter moving out of the jurisdiction, there is a lag between the move and the official receiving the change-of-address notice or the notice that the mover has registered elsewhere.
Because death generates a lot of paperwork, in most states there is a well-trod path by which the notice that a voter has died reaches the election official. Even so, it reaches them with a lag. Moving is less likely to generate a lot of paperwork — many people do not file change-of-address notices, for instance — and so the information that a voter has moved out of the state may never reach the official.
Thus, “deadwood” — people who have died or moved out-of-state — tends to accumulate on voter rolls. There are methods to trim deadwood from the rolls; for example, the controversial practice of removing registrants who have not voted in two consecutive federal elections, after the registrant has failed to respond to a mailed notice.
Research by Stephen Ansolabehere and Eitan Hersh suggests that around 10% of all the names on voter rolls are deadwood. When looking at the registration numbers in Section A of the EAVS, the topline registration totals are inconsistent with individual registration statistics reported by the state in the same section. This suggests that registration numbers are highly affected by administrative practices regarding voter removal, which vary significantly across states.
Most importantly, all this suggests that the voter registration rolls managed by the states over-state the number of people who are registered and legally eligible to vote because they are resident in the state. This insight led the original EPI developers to search for an alternative way to measure registration rates.
That alternative is to use survey responses from the CPS to determine how many people are eligible and/or registered to vote. This method is based partly on analysis by Barry Burden in The Measure of American Elections, where registration rates calculated using the CPS were found to be less than the rates calculated from administrative statistics. Because the survey-based estimate of the registration rate is also likely to be an over-estimate, due to problems of social desirability bias, and the official statistics are even greater than the survey-based estimates, it was decided to stick with the surveys.
(A confirmation of this reasoning, using registration data stretching back to 1994, was recently reported in a paper presented by MEDSL director Charles Stewart III at the 2019 meeting of the American Political Science Association.)
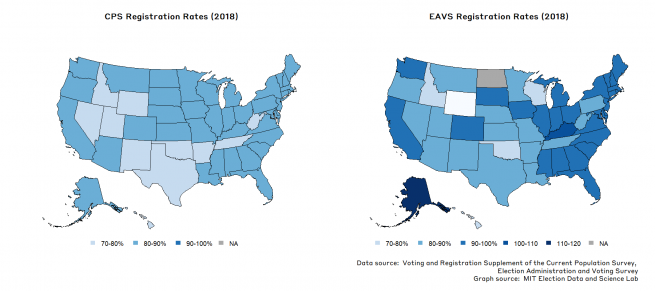
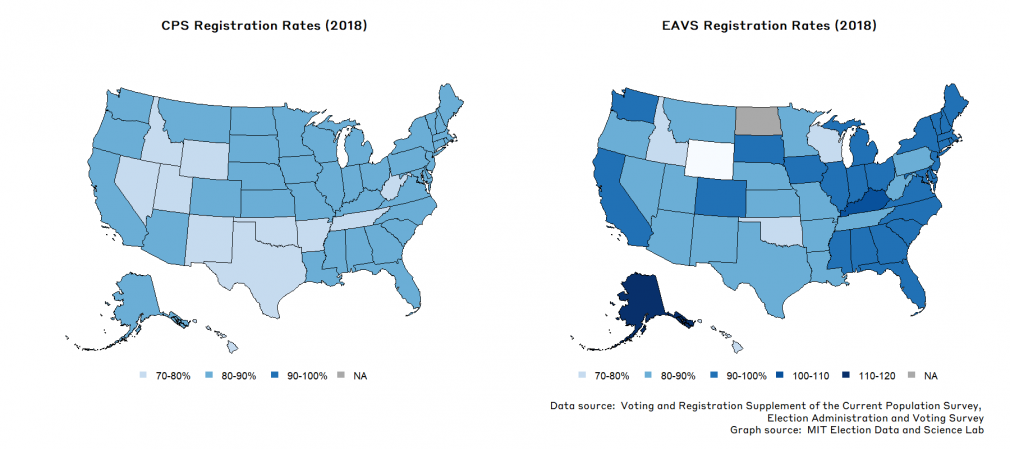
The following two maps display the registration rates as reported by both methods. The first map (on the left,) shows registration rates as calculated from the CPS. The second map shows the officially reported registration rates reported by the EAVS. (A note: the EAVS registration rates use 1-year citizen voting age population (CVAP) estimates from the American Community Survey — which means the numbers would even be higher than what is reported here, as VEP is a subset of CVAP.)
In both, we can see inherent limitations immediately. The CPS relies on self-reported registration; this results in voters in North Dakota (which does not have voter registration) saying they are registered to vote. The EAVS, meanwhile, has high variability in reported registration, with several states reporting rates of over 100%. (For more information on this issue, see the EPI methodology document).
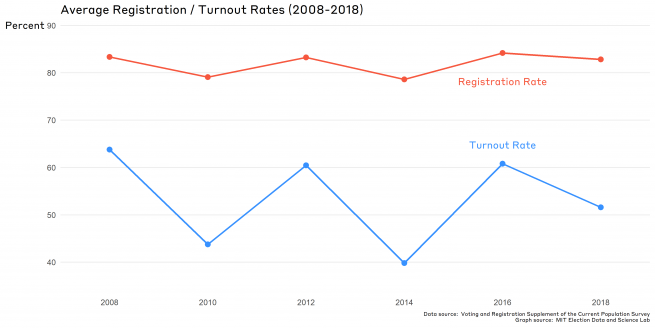
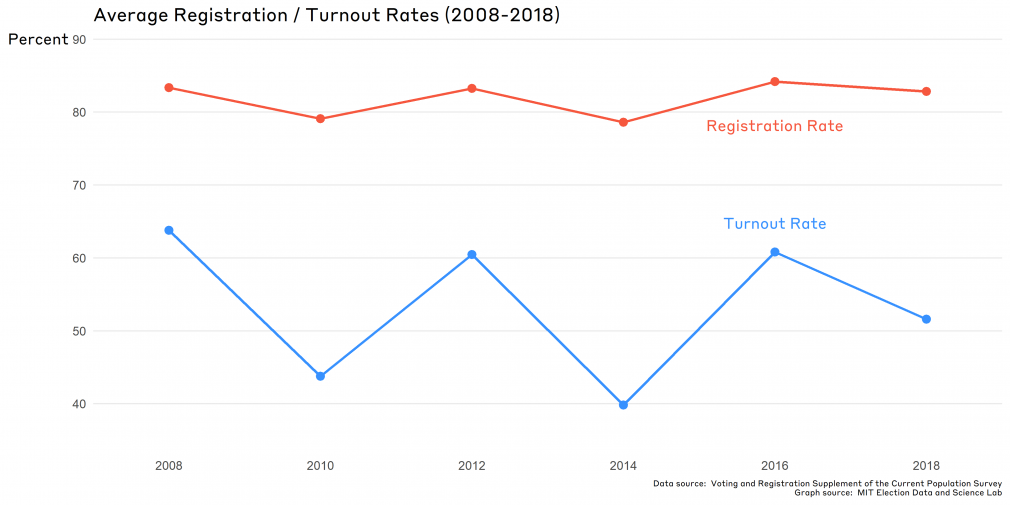
If we examine trends over a longer period of time, we see that the registration rate indicator and turnout rate indicator for the CPS in 2018 were both the highest they have been for a midterm election in a decade. We also see a consistent trend among the CPS measures of greater fluctuation in the turnout rate, with turnout increasing in presidential election years.
The stability in registration arises partly from statutory requirements like the NVRA, which limits the removal of voters from the voter list to a specific set of reasons. Often, this is triggered after two federal elections where the voter does not vote (i.e. every 4 years). We can see this process much more clearly in the states’ reports of registration statistics, which follow a stock-and-flow model. States constantly receive voter registrations, but only clear them once a voter has met the threshold for removal.
Election-Day Registration (EDR)
One policy choice often cited as boosting registration rates is Election-Day Registration (EDR), which allows voters to register the day of the election. According to the National Conference of State Legislatures (NCSL), 15 states had some form of EDR in 2018. An additional three states (Michigan, Nevada, and Washington,) will implement EDR in 2020.
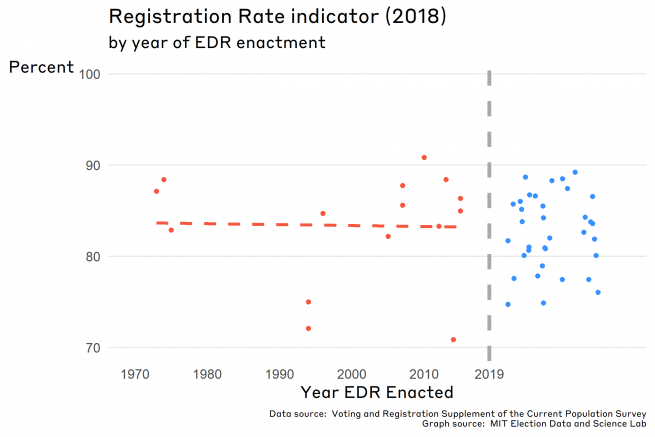
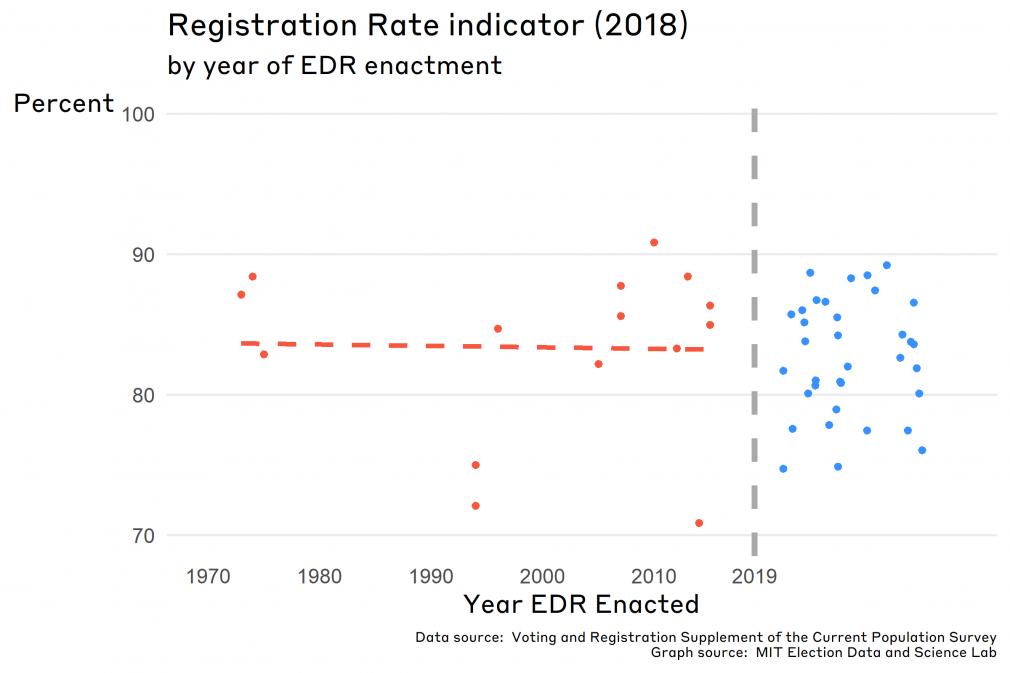
Unlike our previous analysis of EDR in relation to the registration-or-absentee-ballot problem indicator, the relationship in this case is not as clear. When we compare the registration rate of the states with EDR compared to states without EDR, the relationship is negative: states with EDR had an average registration rate of 81.4%, while states without EDR had a registration rate of 84.4%. However, the relationship between a state having EDR and the registration rate is not statistically significant.
These are counter-intuitive results, and help to illustrate the challenges in estimating the causal effects that election reforms have on behaviors such as voter registration. First, it takes a long time for the effects of EDR to be felt; most states with EDR have only passed it within the past decade. Second, it is quite possible for a state with low registration rates to enact EDR, hoping it will cause the rate to rise in the future. This may have been the motivation, for instance, for the recent implementation of EDR in Hawaii — the state with the lowest registration rate in the figure above.
Looking ahead
Alongside turnout, registration is one of the keystone measurements that has continuously helped determine the quality of election administration, highlighting both its challenges and ways to improve. Yet the fuzziness and variability around administrative data has made it extremely unwieldy to determine trend from noise in the past, with researchers often having to rely on data from outside vendors.
Steps are being taken to make administrative data on this measure much more accurate and standardized, which may alleviate some of the issues of stability with state reported numbers in the future. As states improve their voter lists by proactively sharing information on voters who have moved or died (through organizations like the Electronic Registration Information Center, or ERIC), we might see certain uniform practices form that decrease the variability and artificially high registration counts.
