A Closer Look at Turnout
Examining how voter turnout factors into the 2018 Elections Performance Index
The Elections Performance Index is made up of 17 indicators that, taken together, measure the health of an election. Out of these 17, one must be considered an “ur-measure” of elections, surely? One that arose and was put to work in this type of analysis much earlier than the others?
Turnout, for example, answers one of the most common questions in an election: how many people voted? It’s often seen as the mark of a thriving democracy. (Very few convincing arguments have been made for decreasing turnout.) In discussions over any election-related policy, the effects of that policy on voter turnout also come up, almost as a rule. Yet despite this focus, policy change itself often has little to no effect on voter turnout.
So, how about turnout in 2018?
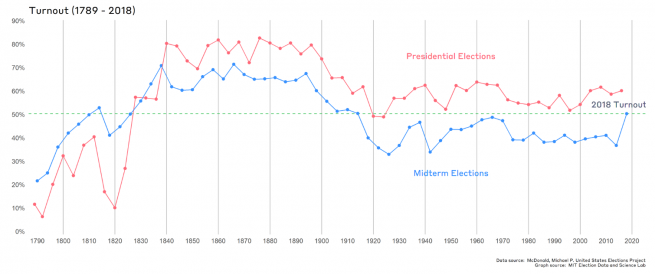
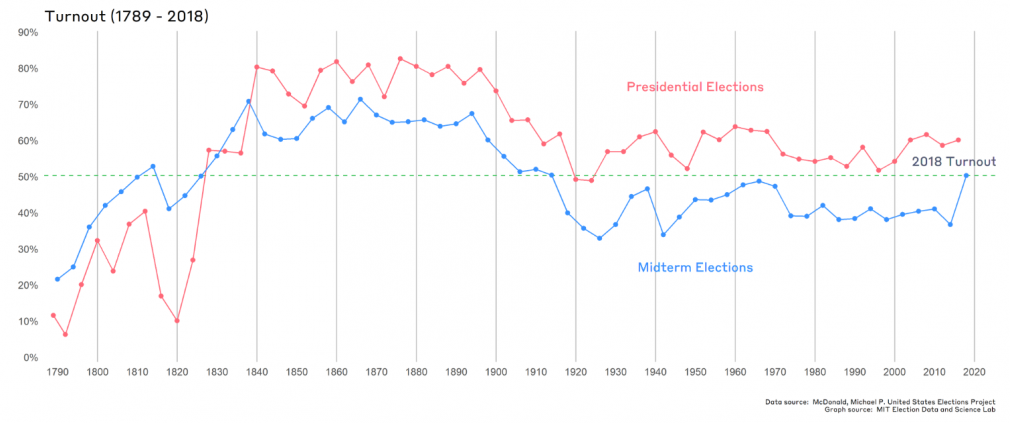
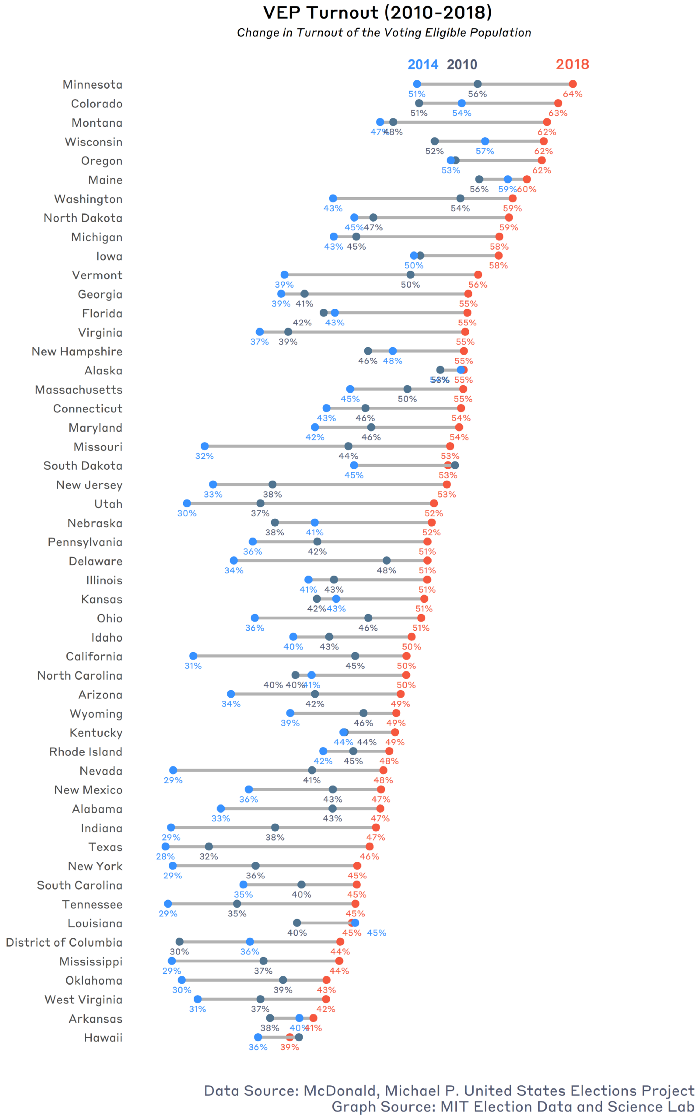
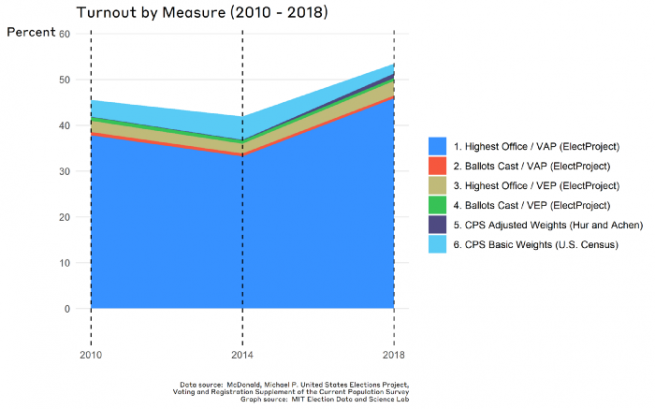
Turnout in 2018 was historically high, with an estimated 50.3% of the voting eligible population (VEP) turning out to vote. This was nearly 14 percentage points higher than 2014 (which was a historically low turnout election), when just 36.7% of voters cast their ballots. With current estimates, only two states are listed as having decreases in turnout from 2014 to 2018, and in both cases, the difference is less than 1 percentage point.
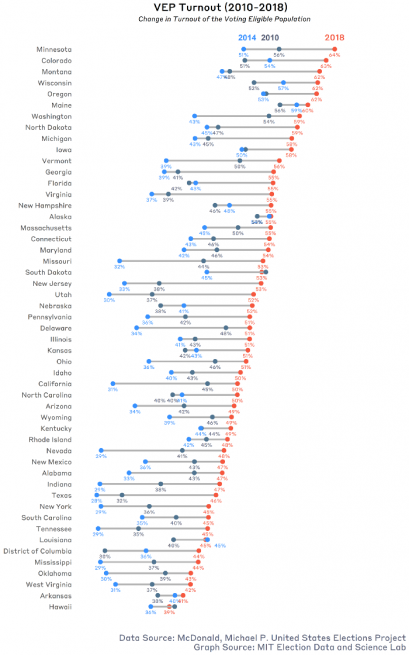
When we break down the data state by state, we start to see differences within the nationwide increase. For example:
- Maine (a consistently high turnout state,) saw an increase in voter turnout of just 1.5 percentage points between 2014 and 2018 — but they also had the highest turnout in 2014, at 59%, so remain as a high-performing state on this measure.
- Utah (a consistently low turnout state,) saw a whopping 22 percentage point increase in turnout, which was the largest in the country.
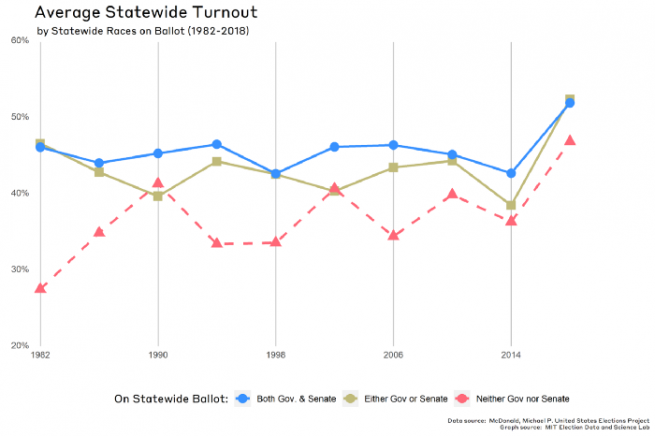
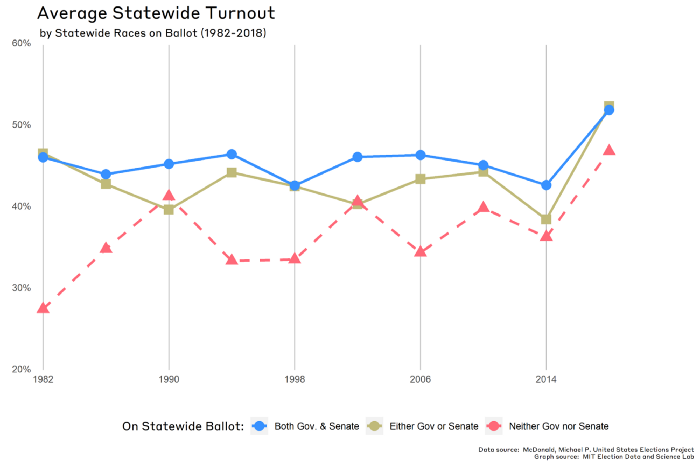
Generally, simultaneous statewide races increase turnout during midterm elections. We see this most often with midterm gubernatorial and senatorial races, but high-profile ballot referenda can have a similar effect. Oddly, 2018 is an outlier in this trend, where states with only a senate or governor’s race outperformed states with both a senatorial and gubernatorial race.
Who turns out?
The private vote, which keeps our individual votes secret, also means we’re unable to tie demographic factors directly to a specific recorded vote, except for age, and perhaps race, if we use data from voter registration lists. Instead, researchers have relied on the Voting and Registration Supplement (VRS) of the U.S. Census Bureau’s Current Population Survey (CPS) to explore demographic factors that affect turnout.
Learn more about the VRS and how researchers use it to study elections over here.
As with other surveys, measuring turnout with the CPS is difficult. Respondents tend to give socially desirable responses or not respond at all when asked questions about their voting habits. Famously, over-reporting and non-responses to the CPS led to an inaccurate conclusion that turnout had decreased from 2004 to 2008. This, in turn, led Achen and Hur to develop a system for weighting corrections for the CPS. These corrections are particularly important when it comes matching turnout to valuable demographic information — the most powerful predictors of turnout.
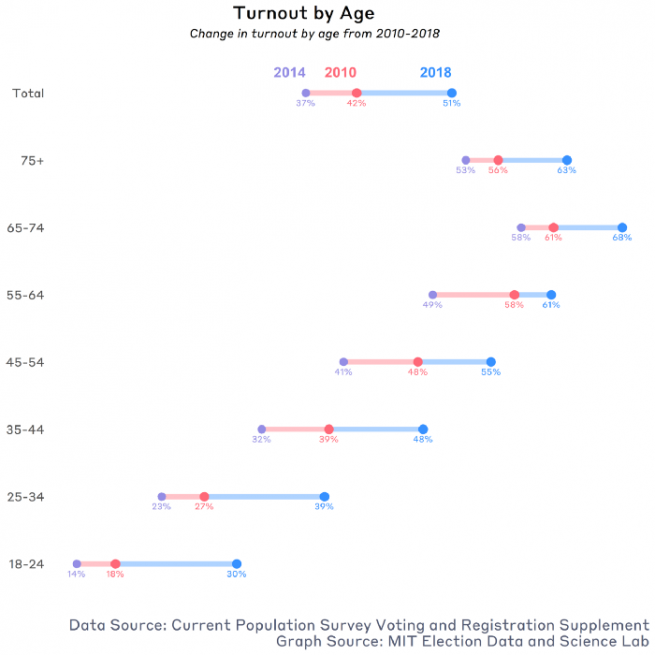
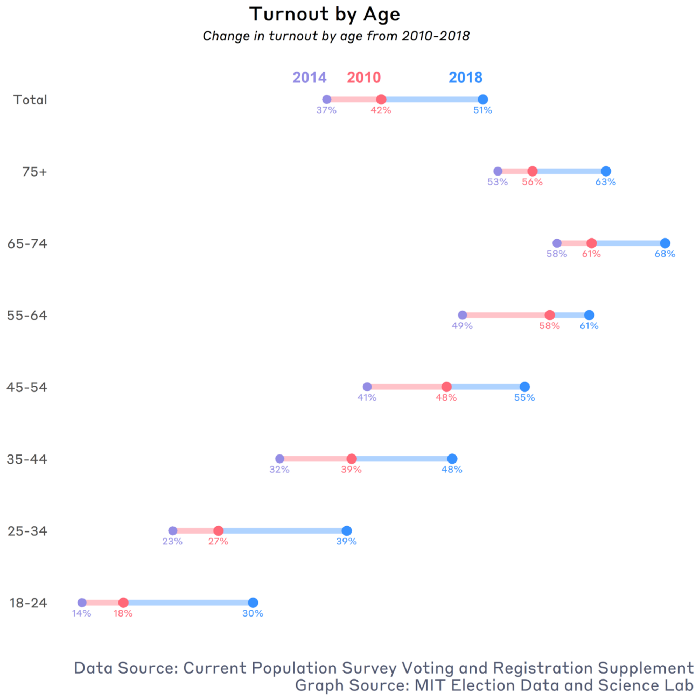
A whole panoply of demographic factors are related to higher turnout. Wolfinger and Rosenstone, for example, showed that specific demographic factors can have an effect on turnout: education, income, and age.
What can that tell us about turnout, particularly in the most recent midterm elections? For one, turnout seems to dip after age 75, which could be related to relatively higher rates of disabilities in the elderly.
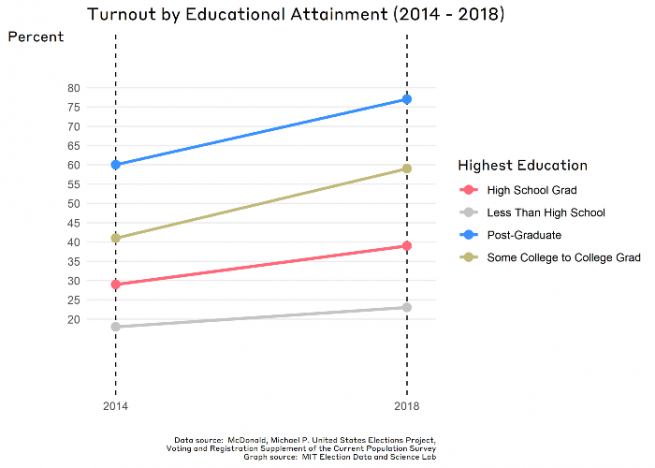
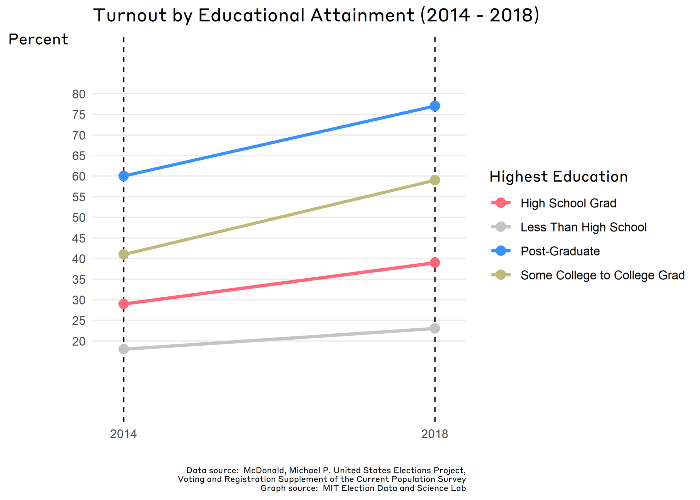
When we turn to look at turnout by educational attainment, respondents who chose “Some College to College Graduate” had an 18 percentage point increase in turnout — a larger increase as those who marked having post-graduate levels of education. The overall trend of more education influencing higher turnout holds strong though: in 2018, nearly 8 in 10 post-graduates voted, while almost 4 in 10 of those without a secondary degree voted. Turnout rates halve again when we look at respondents without high school degrees, who turned out at around 23% — although this was up 5 percentage points from 2014.
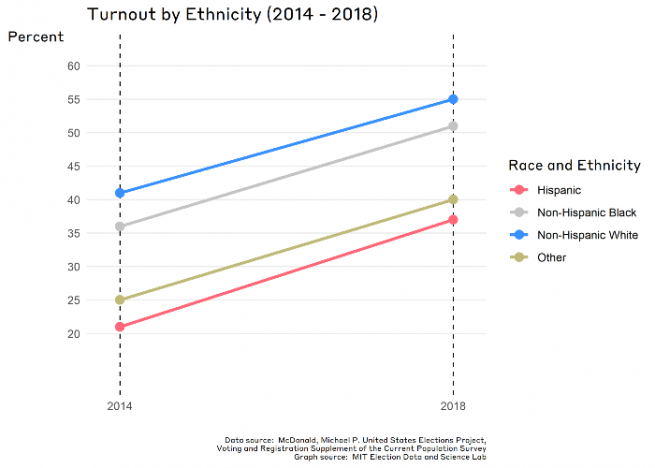
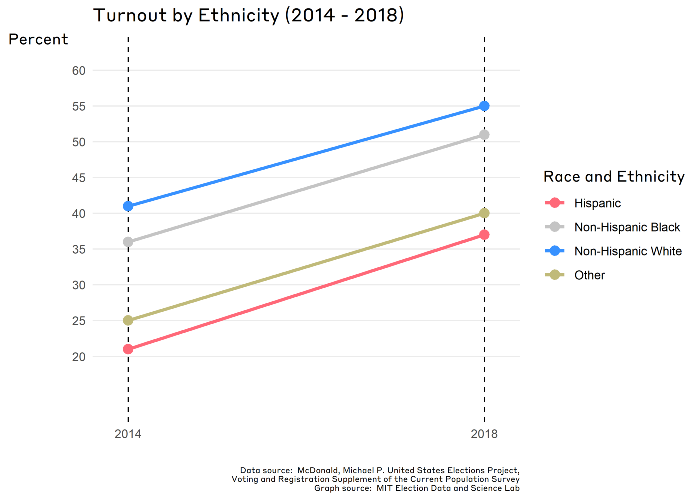
What about race and ethnicity? Research shows that it generally has less of an effect on turnout than either age or education. In 2018, though, non-Hispanic white voters, non-Hispanic Black voters, and Hispanic voters all had increases in turnout of about 15 percentage points across the board — despite non-Hispanic white voters making up 73% of the electorate. This tells us that the 2018 election saw a disproportionately large increase in turnout for non-Hispanic Black voters and Hispanic voters.
How to measure turnout
As a concept, turnout is pretty simple. In part because of that apparent, appealing simplicity, it’s a very popular measure for elections. Measuring it, unfortunately, is a bit more complex.
There are a number of sources and methods for measuring turnout; for any of them, it’s important that the criteria and numbers chosen to represent it provide an accurate reflection of what turnout actually is. Often, we define turnout as the total number of ballots submitted that are counted for a particular election, as this method avoids issues in how to count or measure spoilage from some form of voting ineligibility. But this runs into other issues, because not all states report the total number of ballots submitted in an election.
In these cases, we often get our numerator to calculate turnout from the number of ballots cast for the highest office on the ballot—in a midterm election, that might mean the race for governor, or a U.S. Senate seat.
So, that’s the numerator taken care of. What about the denominator? That’s a much more complex question, because we have many numbers to choose from. It gets at the thornier question underlying turnout: what are we measuring against?
We could use the total number of registered voters, or active registrants, for a particular election. As we noted recently, increases in registration can often be indicators of increases in turnout, although it can also mask changes in our turnout calculation. (If the denominator — registration — changes, this can hide simultaneous changes in the numerator — the number of ballots cast.) Furthermore, registration is often subject to and affected by issues of administrative policies, such as how and when the state removes registrants.
More commonly, we use the voting age population (VAP), as well as the voting-eligible population (VEP) as our denominator to measure turnout accurately. VAP is simply the measure of the total population over the age of 18; it can be taken either from the CPS, or the American Community Survey (or decennial Census) for subdivisions smaller than the state.
VEP is calculated in a couple of ways. The best-known method is implemented by its originator, Professor Michael McDonald at the University of Florida, who uses a variety of data sources to adjust VAP for those who are ineligible to vote, such as disfranchised felons and non-citizens. (McDonald’s calculations are published on the United States Elections Project website.) It is also possible to calculate another estimate of VEP using the CPS.
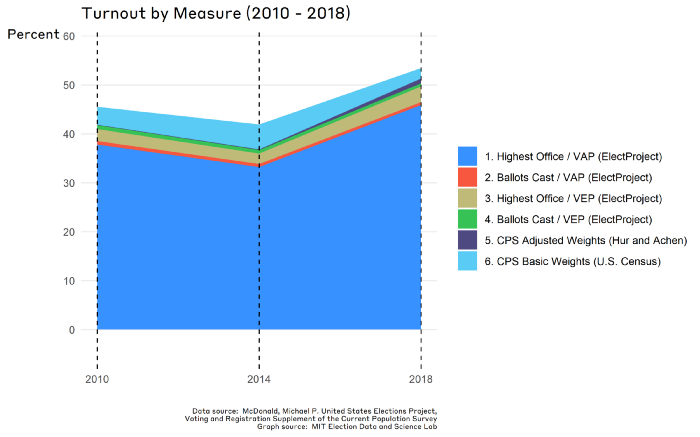
Below, we’ve displayed the different ways of measuring turnout between 2010 and 2014. Looking at it, we can see that the two statistics related to demographics (CPS Adjusted Weights) and overall turnout (Ballots Cast / VEP) are very close.
Turnout is an obvious inclusion for any effort measuring elections, and will be interesting to track in the future as well. While turnout in 2018 was significantly higher than in 2014, those increases weren’t spread evenly among states or demographics. We don’t know yet what the 2018 turnout means for the election in 2020 (beyond looking at historical data that show presidential election years tend to have higher turnout than midterms), but it is fair to say that turnout will continue to be a focal point for monitoring the health of elections.
