>
Elections
Performance Index
  • DATA
  • LEARN
  • ABOUT
Back to Learn

All articles by Claire DeSoi

6 Articles

A U.S. flag waves gently on a tall silver pole. The sky behind it is blue, with a few fluffy white clouds.

03.10.2022

2020 Was a Banner Year for U.S. Election Administration

MIT’s Election Performance Index shows improvement across the board.

By Claire DeSoi

A dark blue graphic, with white text that reads, "Despite the fact that elections drown in data, ... election administration has largely escaped this data revolution."

10.12.2020

Under the Hood of Election Science

Data from the Election Assistance Commission

By Claire DeSoi

An American flag waves in a breeze

08.20.2020

How Effective Is Election Administration in the U.S.?

The Elections Performance Index has Answers

By Claire DeSoi

A page from a census report dated Jun 5, 1900, from Manhattan, New York.

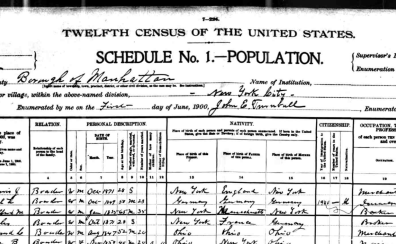
11.18.2018

Under the hood of election science, again

The U.S. Census as a source of data on elections

By Claire DeSoi

A close-up shot of pliers, wrenches, and other tools, all a bit greasy and clearly well-used.

10.30.2018

What’s Running Under the Hood of Election Science?

A MEDSL miniseries on data sources

By Claire DeSoi

A navy banner that reads "Elections Performance Index: Measuring the 2016 Elections. Now Available online at elections.mit.edu."

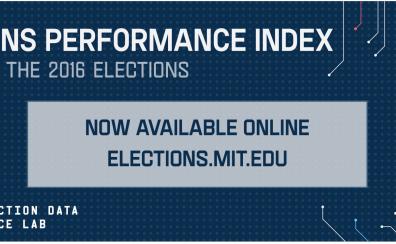
08.09.2018

U.S. Election Management is Improving

The Elections Performance Index re-launches with 2016 data today — and the news is good

By Claire DeSoi

>
Elections
Performance Index
A PROJECT OF MIT ELECTION DATA & SCIENCE LAB
©2025 Massachusetts Institute of Technology Election Data + Science Lab | Accessibility
77 Massachusetts Avenue
Cambridge, MA 02139
(617) 253-3127
mitelectionlab@mit.edu
twitter twitter facebook facebook instagram instagram medium medium linkedIn linkedIn
A PROJECT OF MIT ELECTION DATA & SCIENCE LAB
©2025 Massachusetts Institute of Technology Election Data + Science Lab | Accessibility