Using the Census
A look at data from the 2020 Voting and Registration Supplement to the Current Population Survey
The Elections Performance Index (EPI) measures the performance of elections in all 50 states and the District of Columbia. A major tool we use is the Current Population Survey’s Voting and Registration Supplement (VRS). With the VRS, we can study turnout and related questions from the perspective of race, age, disability status, and other demographics.
Conducted by the Census Bureau for the Bureau of Labor Statistics, the Current Population Survey (CPS) is a monthly survey that measures unemployment and labor force participation. It also has a series of supplements, which are conducted at different intervals and ask additional questions for particular areas of research. Of these supplements, the Voting and Registration Supplement (VRS) is conducted after each federal election that helps describe how people registered to vote the modes they used to cast ballots. .
The CPS provides information about participation in the election from the perspective of voters and nonvoters, in contrast to other data sources, such as the Election Administration and Voting Survey (EAVS), which gathers information from election administrators. Due to the CPS’s longevity, national reach, and large sample size (usually around 60,000 households), we can use it to investigate questions regarding the effects that changes to election policy or systems have on participation, and how those effects vary by demographic characteristics such as employment, race, age, or physical disability.
Getting the participation rate right
Because of the CPS’s deep bench of demographic information, it can be a great tool to study turnout and registration patterns. But, for that to be true, we need to know that it is accurately capturing turnout and registration rates.
Because of social desirability bias, any survey on voting that relies on self-reporting is likely going to overestimate turnout and registration. Some academic surveys, such as the Cooperative Election Study and the 2020 Survey of the Performance of American Elections, conduct post-election voter validation studies and identify respondents who actually voted and those who do not. Although the VRS does not do voter validation, it is possible to account for its turnout overestimation at the aggregate level.
The CPS further complicates matters because it categorizes non-responses to the voting question the same as respondents who say they did not vote. This obfuscates the degree of social desirability bias in the CPS compared to other voter surveys. Still, even with non-respondents counted as non-voters, the reported turnout in the CPS remains higher than the adjusted turnout we can calculate using the United States Election Project.
To correct the CPS over-report of turnout, MEDSL does two things that have become standard among political scientists. First, we exclude non-respondents in calculating turnout and only consider those who answered the turnout question. Second, we use a method devised by Aram Hur and Christopher Achen to reweight the survey according to the actual turnout as recorded by the respondent’s state.
One other thing to note is the uncertainty of responses around race/ethnicity and turnout. Recent research by Ansolabehere, Fraga, and Schaffner show that the CPS systematically overestimates Black and Hispanic voter turnout compared to the voter rolls. They also note that for every presidential election from 2008 to 2016, African Americans and Hispanics who report voting in the Cooperative Election Study are less likely to be confirmed voters when their report of voting is validated against the voter file. Compared to the other categories, there is far less certainty around the turnout by race, especially for smaller race/ethnic groups after responses are subset by state. In other words, despite the large number of observations in the CPS, it is probably not a reliable data source for comparing turnout rates across racial groups within states.
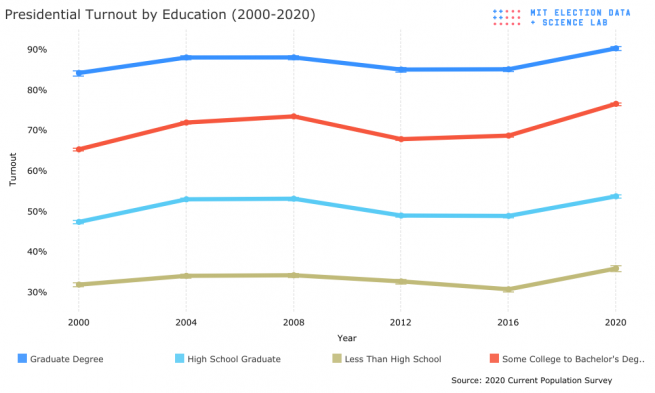
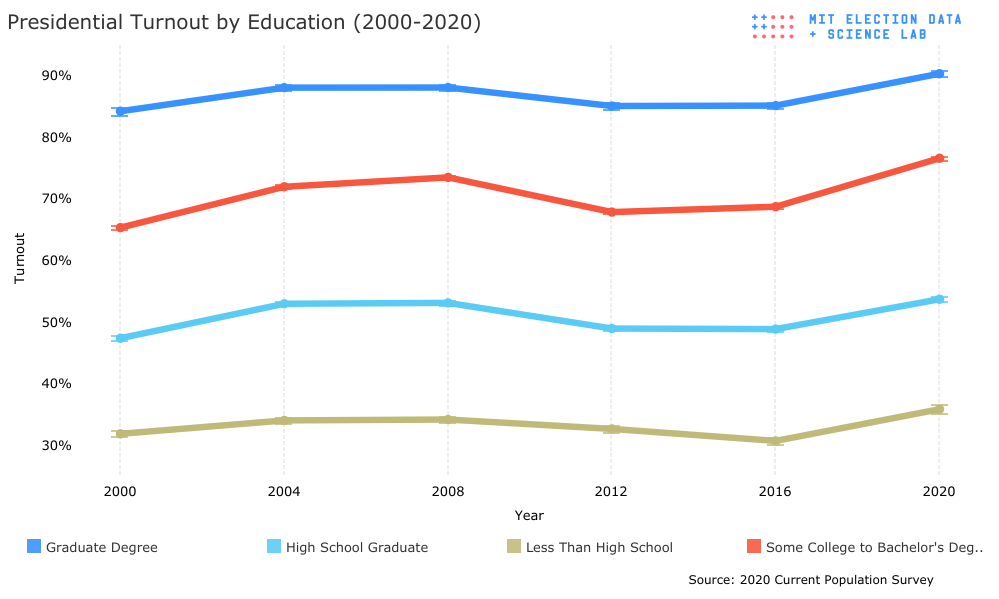
Turnout by education and age follow well-known patterns that have been consistent for years. Older and better-educated citizens are more likely to vote, with turnout rates of various subgroups moving in parallel from election to election. The one possible exception is turnout among those 60 and older, which has been rising unabated since 2000.
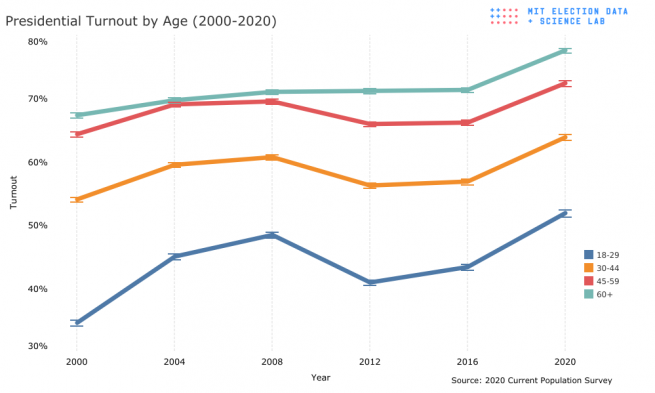
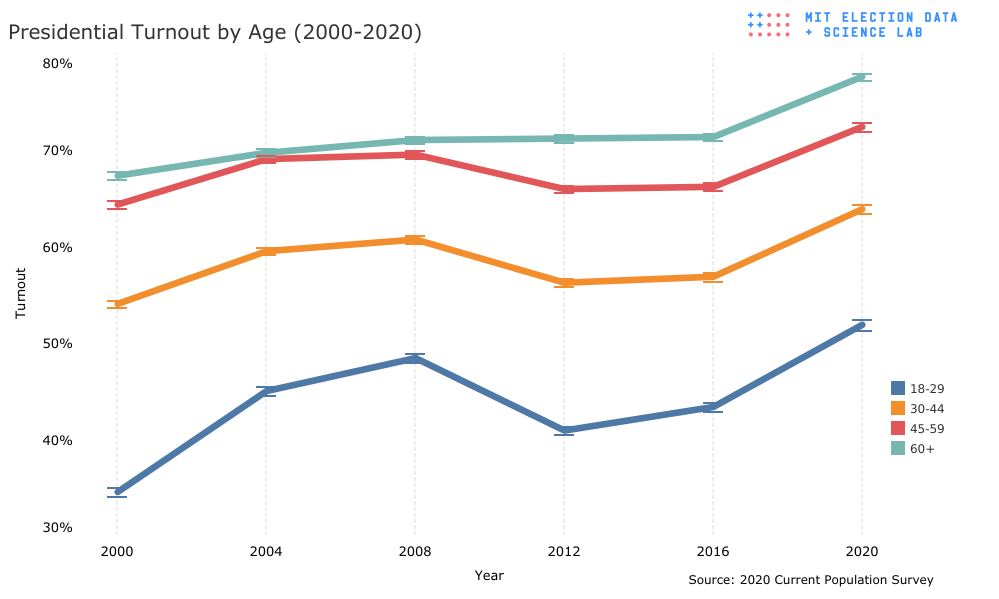
Turnout has been highly correlated with age, with young voters being far less likely and far less consistent voters compared to older voters. In the figure below, we see that the interyear variation of turnout rates is higher for younger voters and becomes more consistent as voters age. Across all groups, even the stable 60+ group, there was a large increase in turnout in the 2020 election. One note: despite voters age 60+ having more consistent and higher turnout, voters over 75+ actually consistently have lower turnout. This could be due to the documented increase in reported disabilities among older voters and their relationship to non-voting.
Changes to why respondents did not vote
The EPI includes indicators that gauge problems voters had with registration and whether people with disabilities had a difficult time voting. These indicators rely on answers to the following question, asked of those who report they did not vote in the recent federal election:: What was the main reason (you/name) did not vote?
For many years, respondents have been given thirteen response categories to choose among in answering this question. The most common answers have typically been “Not interested, felt my vote wouldn't make a difference” and “Didn't like candidates or campaign issues;” the least common answer has typically been “bad weather conditions.” In 2020, an additional response was added, “Concerns about the coronavirus (COVID-19) pandemic.” Just over four percent of non-voters gave this response, which makes it one of the least-used responses. Still, if the COVID response category had not been present, these respondents would most likely have chosen another category.
As the following table indicates, the biggest change in reasons given for not voting in 2020 compared to 2016 was “Did not like Candidates or Issues,” which fell by over ten percentage points. This means that responses for other categories had to grow in relative size. Some of the redistributed responses were taken up by the new COVID-19 category, but notable increases also occurred among the “not interested,” and “other” categories.
|
Reasons for Not Voting |
2012 |
2016 |
2020 |
|
Not Interested |
15.69% |
15.42% |
17.60% |
|
Did not like Candidate or Issues |
12.67% |
24.76% |
14.55% |
|
Other |
11.11% |
11.12% |
14.49% |
|
Work/School Conflicts |
18.91% |
14.30% |
13.13% |
|
Illness or Disability |
13.98% |
11.65% |
13.00% |
|
Out of Town |
8.57% |
7.91% |
6.07% |
|
Registration Problems |
5.48% |
4.39% |
4.90% |
|
COVID-19 |
4.31% |
||
|
Forgot to Vote |
3.88% |
2.98% |
3.72% |
|
Inconvenient Polling Place |
2.67% |
2.14% |
2.62% |
|
Don't Know |
2.32% |
1.95% |
2.40% |
|
Transportation Problems |
3.29% |
2.60% |
2.37% |
|
Refused |
0.60% |
0.68% |
0.67% |
|
No Response |
0.05% |
0.04% |
0.11% |
|
Bad Weather |
0.79% |
0.05% |
0.06% |
The addition to a new category will certainly affect the two EPI indicators that rely on answers to this question. At the same time, the increase in turnout will decrease the number of voters who were affected by registration problems or disability, which will probably have a bigger influence on how those two indicators move for the 2020 election. Future blogs in this series will take on this issue.
A new user-friendly portal to the use of the VRS
The VRS has not always been easy to use, especially among neophyte data scientists or those unfamiliar with Census Bureau data. The demise of the Census Bureau’s Dataferret service and the confusing user interface of the system that replaced it raise the barrier to its use even further. To help overcome barriers to using the VRS, the Early Voting Information Center at Reed College has created a GitHub repository and R package called ‘cpsvote’ to facilitate use of the VRS. The R package facilitates reading Census microdata, labelling and factoring variables, and applying the Hur and Achen turnout weights. MEDSL has created a quick fork of the repository and updated it with 2020 data, which should serve users well until EVIC updates their site.
Conclusion
The CPS is an invaluable tool for the quantitative analysis of participation and studying the effects of election reforms on turnout. For the 2020 election, it has shown that turnout increased across all major demographics. Changes to question wording may affect how the EPI indicators about registration problems and voting by people with disabilities perform, which we will be exploring in future blogs. The CPS is not always easy to use, but for those hoping to learn more about turnout on a systematic basis, there is no clear path around it.


