
How long did you wait at the polls in the November 2020 election? 10 to 15 minutes, 30 minutes, maybe an hour, or perhaps even more?
What might surprise you is that whether you're a Floridian, Texan, New Yorker, or even a Michagander, the answer to that question varies greatly. Gathering information on wait times at poll locations is just one of many valuable insights the Survey on the Performance of American Elections, or SPAE, provides. The survey allows election scientists to collect individualized accounts about Election Day and voting activities, allowing them to pinpoint differences between states that are reflected in the individualized voting experience.
The secret sauce of the SPAE lies in its sample size and design. Rather than amassing thousands of respondents from one nationwide survey, the study samples within each state and D.C. Second, the survey collects data from at least 200 individuals from every state. Together, these two factors allow each state, regardless of size, to be studied with comparable precision.
This state-level focus is the core reason why the SPAE exists: it provides data that can inform state-level election improvement. After the 2000 election, claims circulated about voter experience in American elections that were not backed by data on voter experiences, but rather by media accounts. To address the actual issues at play, we needed data. So, in 2008, a team of researchers associated with the Caltech/MIT Voting Technology Project set out to remedy this disconnect between voter experience and media portrayal through data. Thanks to support from the Pew Charitable Trust, the SPAE was born.
The SPAE in 2020
Fast-forwarding to 2020, the SPAE helps to illuminate some of the nuances of the voting experience during a pandemic. The core questions of the SPAE remain the same in each iteration of the survey; these include important questions such as those focused on wait times, poll locations, and voter registration. In 2020, however, the usual questions were also joined by a battery of COVID-19-related questions. Some of the most notable findings from the survey include:
- COVID-19 was the top reason for why voters opted to vote by mail,
- 87 percent of in-person voters reported seeing poll workers wearing masks, and
- average wait times to vote increased for all modes of in-person voting in most states, as visualized in the maps below.
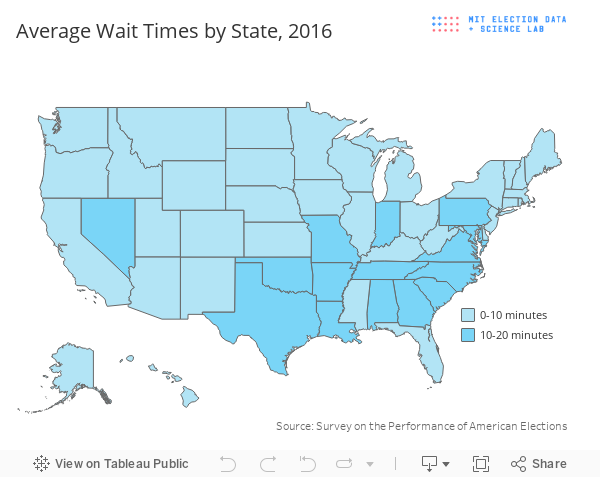
Image description: A map of the US with different shades of blue showing the average wait time in that state for 2016. All states are under 20 minutes, most states are under 10.
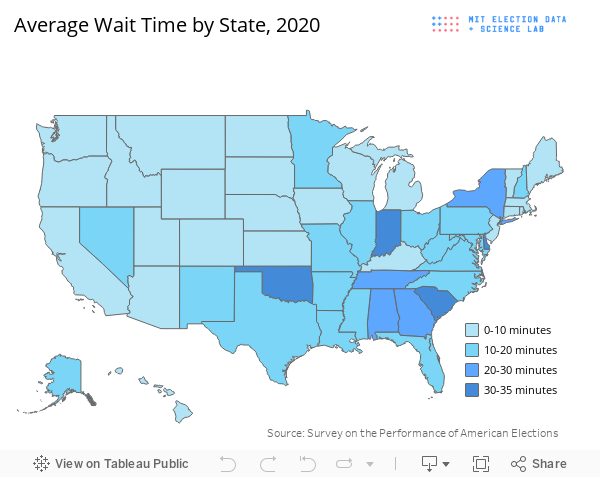
Image description: A map of the US with different shades of blue showing the average wait time in that state for 2020. While most states remain under 20 minutes like in 2016, a handful of states are between 20-30 and over 35.
When we compare the data to previous elections, the 2020 SPAE remained consistent in trends on voter confidence, attitudes on vote by mail, election fraud, and reform. Yet, unlike previous years, partisans were more likely to diverge in their attitudes on confidence, vote by mail, fraud and reform in 2020. Attitudes on election reform were similar between partisans, but there was a notable split on attitudes regarding increasing vote by mail, which was largely opposed by Republicans.
The greatest partisan differences emerged in states with close races; Republicans were most likely to express lack of confidence that their vote was being counted correctly and in vote by mail in states where races were tight. Similarly, voter confidence split, with Democrats feeling more confident and Republicans feeling less confident that their vote was counted correctly. Interestingly, Democrats are largely responsible for the increased gap in these differences when compared to previous years. In other words, compared to 2016, the increase in the confidence expressed by Democrats was much greater than the decline in confidence expressed by Republicans.
That the SPAE largely attributes differences between partisans to changes among Democrats on these issues may come as a surprise, after months of heavy media focus around the uptick in Republican lack of confidence and concerns of voter fraud in the 2020 election. It is precisely this divergence in expectation which highlights both the value and the shortcomings of the SPAE. The SPAE was not designed to catalogue emotional experiences during voting, but rather rely on voters as informants to collect data on election administration. As the eyes and ears of polling places, voters can accurately inform about wait times, whether poll workers follow COVID-19 protocol, and describe the ease or difficulty of casting a ballot or registering to vote. This information is invaluable. However, by design, the survey does not ask individuals emotional and psychological questions. The survey sticks to the facts, without delving into partisan emotions, with the intent of providing data that can be used by election officials, scientists, and legislatures to improve election administration, accessibility, and the voting experience nationwide.
The Future of the SPAE
SPAE (and MEDSL) founder Charles Stewart hopes to expand the SPAE further by extending the survey to different geographic locations. SPAE-like surveys that have been administered at the county-level in Florida and California have proven valuable. By gathering similar information in smaller localities, the SPAE can allow for more granularity, specificity, and reliability in findings by comparing county-level to state-wide results.
Additionally, a possible future of SPAE administration would include a mechanism to confirm the experiences the voters detail in the survey. Formally measuring wait times at poll locations and cross-checking those times with voter reports would be one example of a way to corroborate the experiences that survey respondents provide. In another vein, sampling mail-in voters before election day and gathering accounts closer to when they voted as opposed to after election day could help mitigate any memory issues in reporting experiences.
The SPAE, the only public opinion project of its kind to capture voter experience, helps to gain an inside perspective into Election Day and voting activities. The survey contributed to the understanding of election administration in 2020, and hopefully will remain a consistent and reliable window into the most fundamental and important aspect of Election Day: casting a ballot.


