Through the last two general elections, concern has grown over the amount of time Americans spend waiting in line to vote. After long lines and wait times made headlines in 2012, Barack Obama cast a national spotlight on the issue, mentioning it in his election night speech as well as the following year’s State of the Union address. Soon after, it was made an early priority for the newly-formed Presidential Commission on Election Administration (PCEA). While the issue would later fade from public discussion about the 2016 election, at the time, long wait times during the primary and general elections were, at the time, a high-profile topic for heightened scrutiny and debate.
Why does the length of time it takes to vote matter? Wait times are generally seen as an indication of how easy it is to cast a vote; long waits to vote can be a barrier to greater public political participation. The recently released 2016 Election Performance Index (EPI) documents wait times since the 2008 election, shedding light on an important aspect of election administration and democracy. This post explores the measure in the EPI data, and some of the surrounding research on wait times.
Measuring Voting Wait Times
The “Voting Wait Time” indicator in the EPI captures the average time spent waiting in line to vote at the polls. (In states with a vote-by-mail option, the metric gauges the time spent dropping off a ballot in a drop box.) The data used to calculate it comes from the MIT-run Survey of the Performance of American Elections, which conducts and compiles online interviews of registered voters in the 50 states and Washington, D.C. about their voting experience.
When asked “approximately, how long did you have to wait in line to vote?” survey-takers in 2016 could indicate:
- not at all,
- less than 10 minutes,
- 10–30 minutes,
- 31 minutes to an hour,
- more than an hour (where the respondent supplied an exact waiting time), or
- “don’t know.”
Responses were then converted to average minutes spent waiting based on these ranges, producing the metric used for “Voting Wait Time” in the EPI.
The EPI dataset includes wait time averages at the state level for the last three presidential elections and the 2014 midterm election. Looking at data from these elections, how have voting wait times changed?
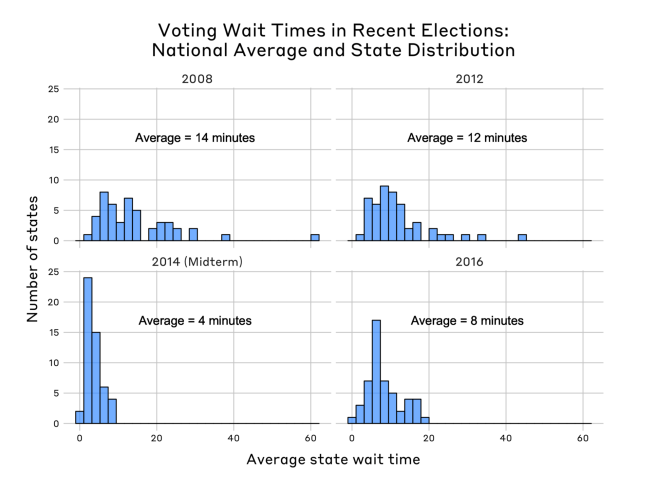
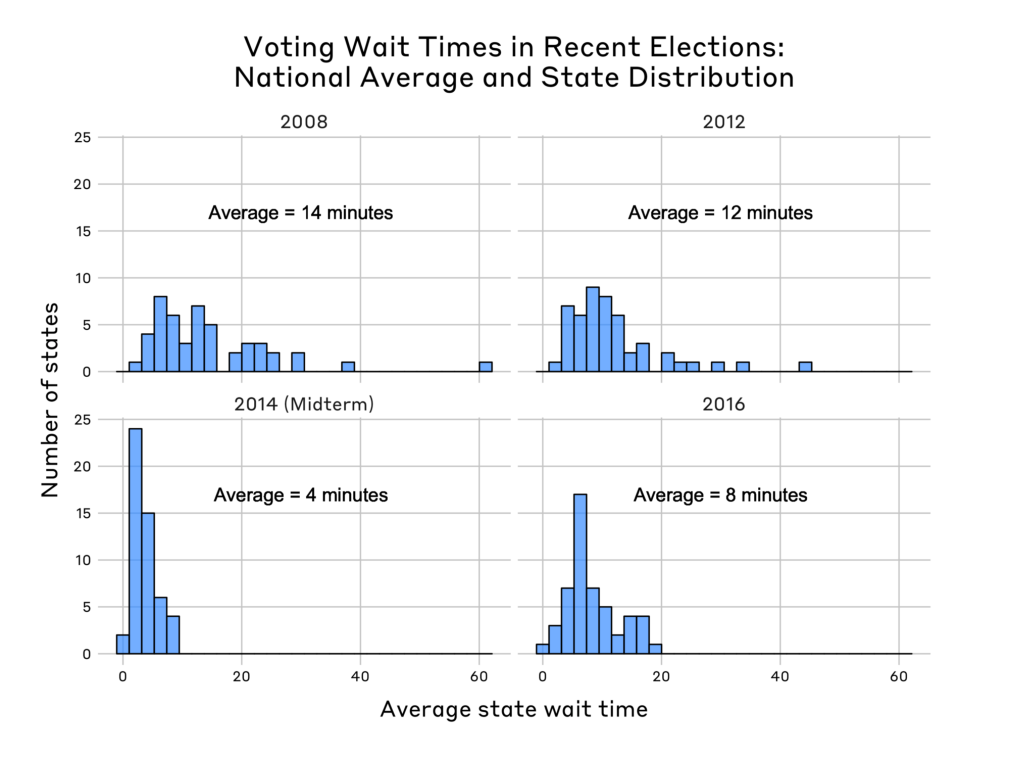
Let’s look first at the distribution of state voting times and the average national wait time in each election year:
In general, we can see that there’s been a trend toward shorter wait times. The fairest comparison involves only data from the presidential elections; although 2014 boasts the shortest average wait time — just 4 minutes — this is more likely an effect from being a midterm year, which tend to have fewer voters turning out to cast a ballot at all.
For general elections, the average wait time decreased from 14 to 12 minutes between 2008 and 2012; it dropped again in 2016 to an 8-minute average. The average American voter thus experienced the shortest wait time to vote in 2016 in the history of the SPAE. (Note that the results don’t change when the size of each state’s voting population is accounted for.)
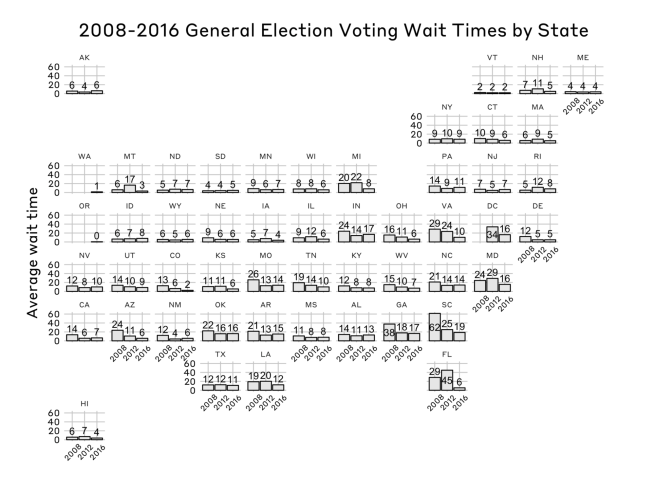
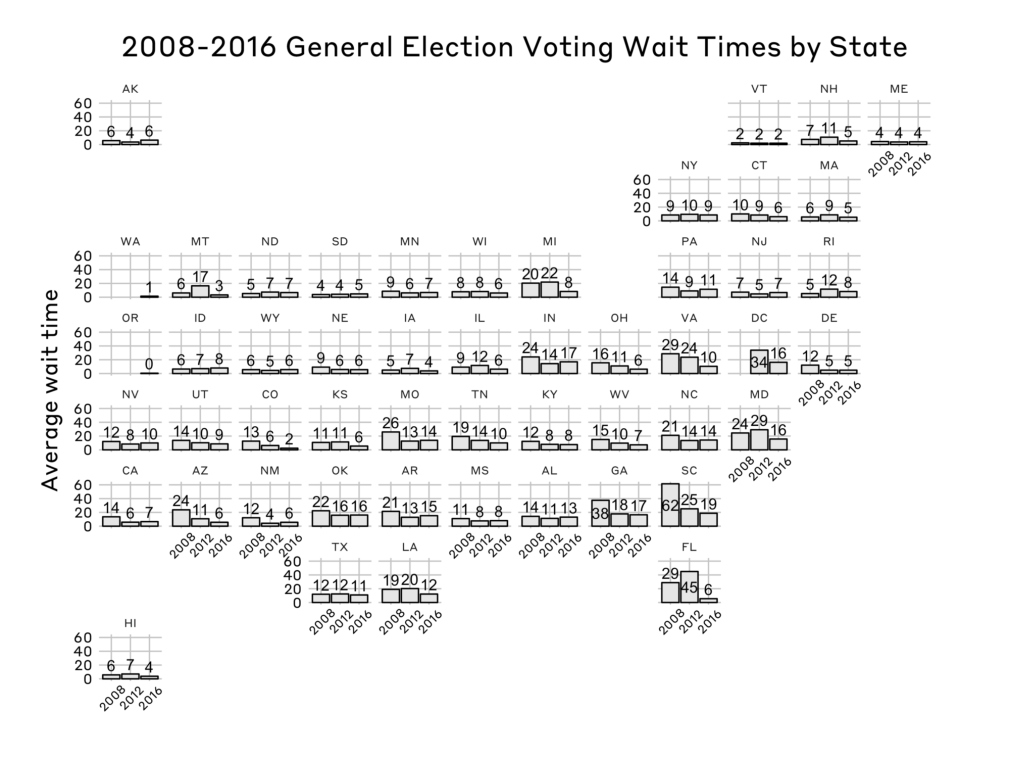
State-level patterns add some nuance to this overall improvement — the plot here shows the yearly average wait time for the last three general elections at the state level:
Although some states’ wait times have remained fairly stable over time, others have seen considerable improvement. After attracting national attention for long voting lines in 2012 (with a 45-minute average), Florida saw a scant 6-minute average wait time in 2016. Voters in Washington D.C., Michigan, Maryland, Virginia, and Montana also saw decreases in their average wait to vote. In total, 31 out of the 48 states with data from the last two presidential elections saw their average wait time decline. The impetus for these improvements may have been from increased awareness and understanding of the issue following the 2012 election, assistance from the PCEA, or state efforts to provide better staff and resources for polling locations — or all three.
Notably, the shortest wait times in the 2016 election were found in the three states that offer a vote by mail (VBM) option: Oregon (with an average of 0.49 minutes), Washington (1.47), and Colorado (2.40). As McGuire et al. discuss in a recent study of vote-by-mail and ballot boxes in Washington, VBM may offer election officials a tool to remove some of the barriers to voting that arise with long wait times. In Colorado, for example, the average voting wait time declined from 13 minutes in 2012 to 2 minutes in 2016. (The state adopted a VBM system in 2014.) Other election officials seem to be exploring VBM as a promising way to address wait time problems in the future; states like California have begun to follow suit in implementing their own VBM systems.
Understanding Variation in Wait Times
The degree to which voters wait to cast their ballot varies substantially by state. Past research has indicated that state-specific laws and practices are often a key factor in this differentiation. At the same time, research on wait times also shows that, while some states and jurisdictions have long wait times caused by “chronic,” institutional issues, wait time issues can also be due to unique, unexpected events and emergencies.
There is also wide variability in wait times across different segments of the population. One of the most prominent disparities occurs along racial lines: in elections since 2006, non-whites — and African-Americans in particular — have consistently reported longer wait times to vote. The same research that showed this trend also found that even within the same jurisdictions, areas that trend whiter in population are less likely to experience long wait times than their non-white counterparts. In this sense, the study argues that the racial gap may result from a difference in how election officials handle white and minority precincts, including, for example, in the allocation of resources such as poll workers and voting machines.
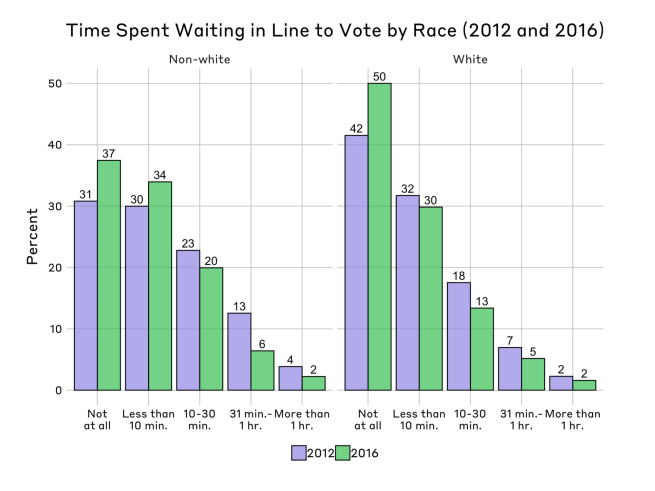
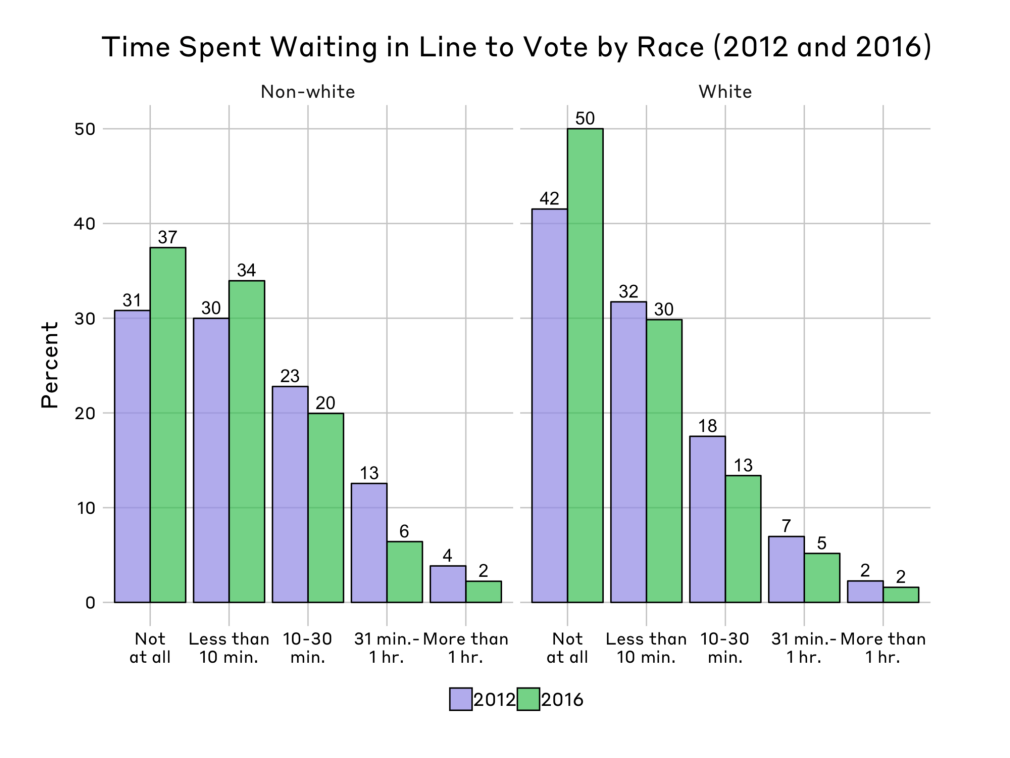
The wait time data that the EPI draws from for its “Voting Wait Time” indicator confirms that this racial disparity continued in 2016. The plot below shows how wait times changed from the 2012 to 2016 election, based on an individual’s race:
In both 2012 and 2016, white Americans faced shorter wait times than non-white ones. Everyone, regardless of race, experienced shorter wait times in 2016 as compared to 2012; in the most recent election, 37 percent of non-whites had no wait to vote (compared to 31 percent four years earlier), while 50 percent of whites had no wait (compared to 42 percent earlier). Despite the gains made in the 2016 election, these numbers indicate that more work is needed to understand and address the racial disparities in wait times.
Given the nuances and importance of voting wait times, the data gathered and presented by the EPI offers a valuable overview for researchers and state officials seeking to understand an element of the election process that has a direct and measurable impact on voters. Serious consequences of long wait times — from economic costs to reduced likelihood of future voting — have been well-documented, but the efforts from the PCEA, scholars, and election officials to address the issue appear fruitful and the most recent election has seen positive changes. Voting wait time thus remains an important area for people interested in election administration to consider.
