The Election Performance Index (EPI) was created to be a comprehensive measure of election administration in each state. Part of that measure is examining the capacity of election administrative practices to accommodate all voters, including voters with disabilities.
The American with Disabilities Act (ADA) in 1990 and the Help America Vote Act (HAVA) in 2002 were intended to increase accessibility to polling places and voting machines for voters with disabilities. As a result, polling place accessibility must go beyond basic ADA compliance — polling places must provide voting options that are both accessible and private. Despite these reforms, however, turnout remains consistently consistently lower for voters with disabilities than those without them.
Even with this persistent gap in turnout, voters with disabilities still made up a total of 11.7% of all voters in 2018. This is a sizeable portion of the electorate; it’s also worth noting that the US population with disabilities has grown steadily, accounting for 13.2 percent of the population as of 2017.
The EPI’s disability- or illness-related voting problems indicator measures the degree to which voters are deterred from voting because of a disability or illness, whether their own or a family member’s.
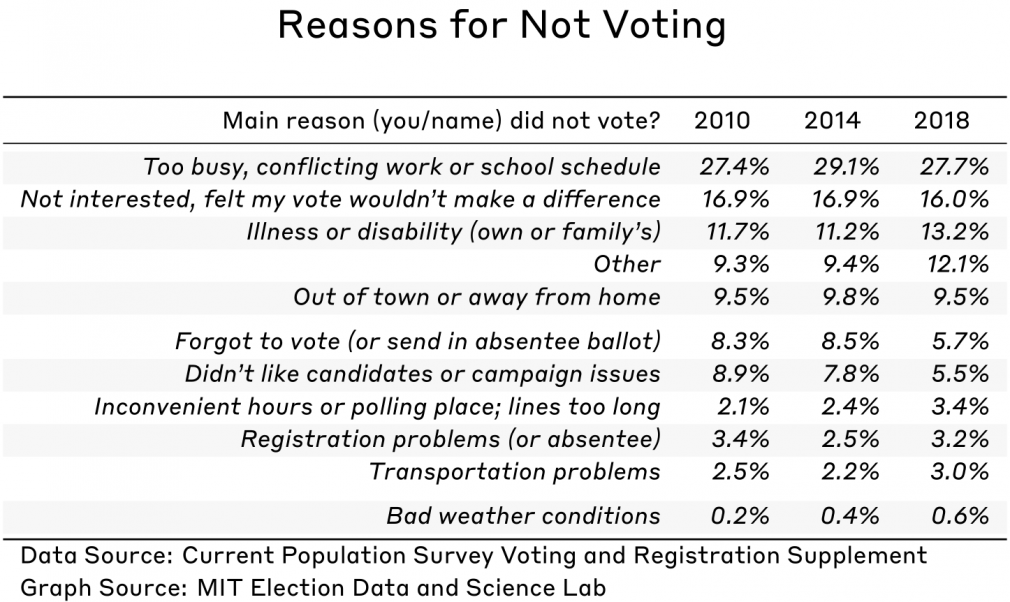
When we updated this indicator to include data from the 2018 election, the average state value remained at 11.8%, the same level as 2014. A low value, for this indicator, indicates better performance — think of these values as the percent of all non-voters who failed to vote for this reason. So put another way: only 11.8% of non-voters reported that they were deterred because of a disability or illness.
Further, when we drill down to individual states, state averages were very close to what they were in 2014. In fact, no states experienced changes in this indicator that are statistically significant. These results are unlike the drop in scores from 12.9% in 2010 to 11.8% in 2014, which did meet the threshold for significance.
Explanation of the indicator and data behind it
The EPI strives to find the most accurate and stable measures of election administration for each of its indicators, but administrative data for this is often nonexistent. As this particular indicator is a measure of a whether a voter did not vote because of an illness or disability, the data for this indicator cannot be collected from election offices. Unfortunately, there are no administrative data collected that would give insight on reasons for not voting due to illness or disability, so we must turn to another source.
A natural source for information about the voting experience is the Voting and Registration Supplement (VRS) of the U.S. Census Bureau’s Current Population Survey (CPS). The CPS is primarily a survey on employment and the economy, while the VRS is added to the survey in the November of federal election years to ask a small number of questions on voting and registration.
Though the sample size is large — around 160,000 households — the VRS is not intended for analysis of subdivisions smaller than the state. (The survey’s large sample size means we can often get state-level information from the data.) The VRS is intended to give a very basic information about voters and nonvoters: for example, asking whether they voted or are registered to vote; and if they did not vote and/or are not registered to vote, why that is.
Which states perform at the high and low ranges of this indicator?
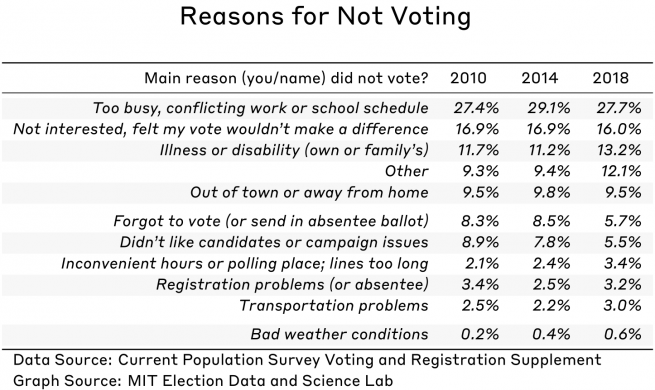
Most states saw little change in the disability- or illness-related voting problems indicator value in 2018. In fact, little change has been the norm for this indicator since the EPI was first reported for the 2010 election. As opposed to the registration-or-absentee-problems indicator, which ranks relatively low as a response to the question “why didn’t you vote,” this indicator is one of the primary reasons cited for not voting. There are only two reasons that are blamed more frequently, neither of which are directly related to the administration of elections (they are instead related to personal or political circumstances).
Let’s take a look at an oft-discussed reform and its effect on voters with disabilities: vote by mail. While it potentially opens up other issues of accessibility, vote by mail is generally seen as a policy that makes voting much more accessible to voters with disabilities.
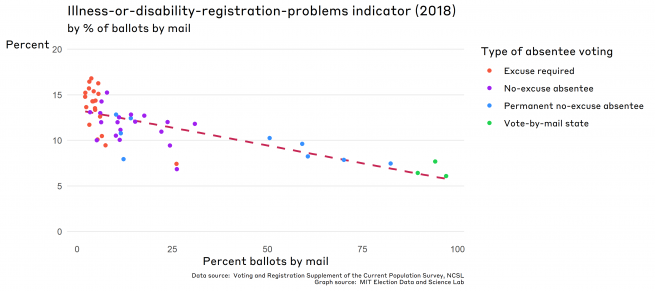
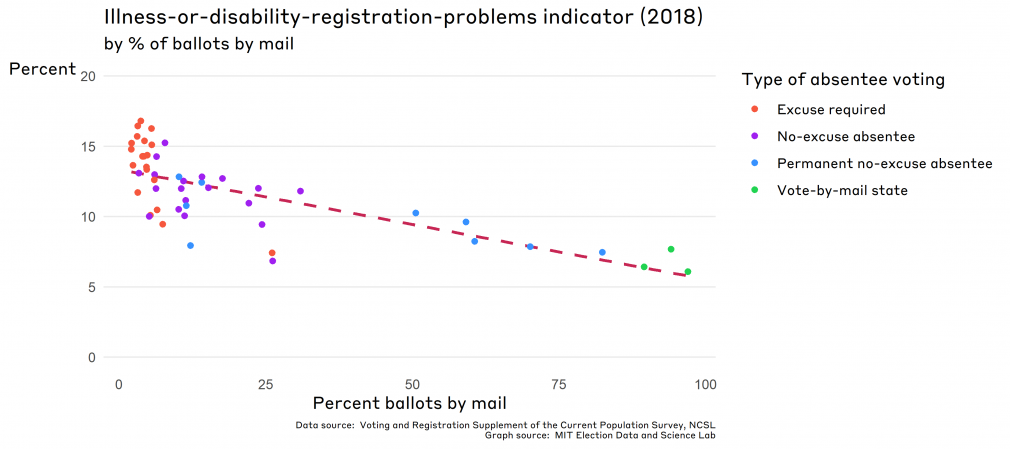
It is probably unsurprising, then, that the states in which more voters return their ballots by mail have lower values of the indicator. Further, it is equally unsurprising to see that the states which conduct their elections entirely by mail, as well as those which allow no-excuse permanent absentee ballots, have larger proportions of ballots returned by mail.
You can see an illustration of this in the figure below, which graphs the value of the indicator in 2018 against the percentage of ballots returned by mail (a statistic that, conveniently, is also derived from the VRS.)
At the far right of the graph are the three “vote-at-home states” (Colorado, Oregon, and Washington) that mailed ballots to all voters in 2018. Considered together, they had the lowest scores on the indicator, with lower scores being good in this case. While there is a lot of variability in this relationship, the general pattern holds.
Looking More Closely at The Disability Gap
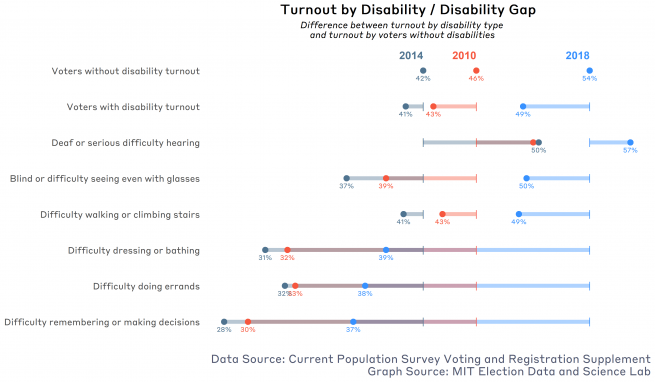
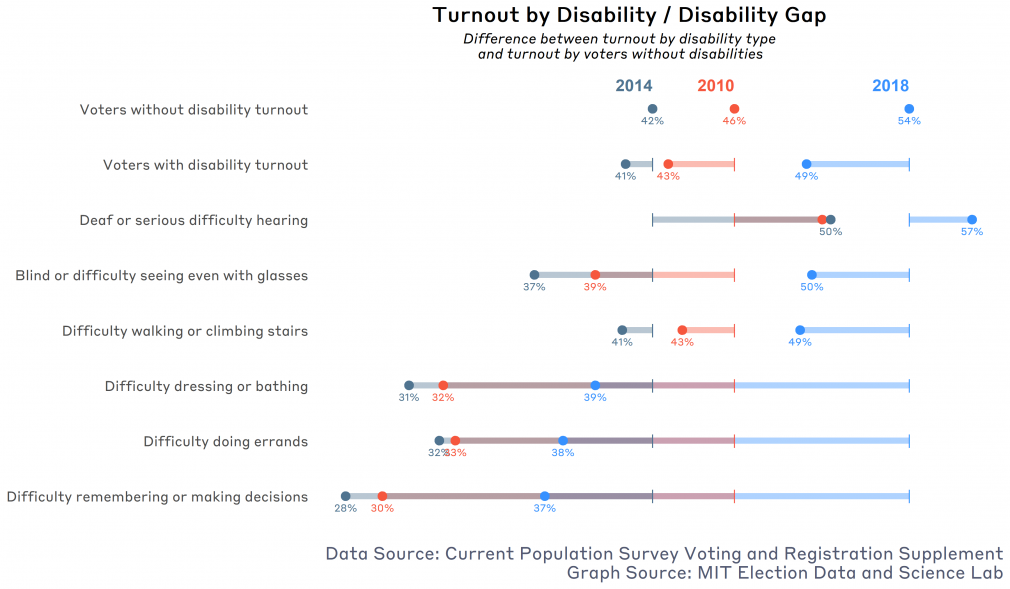
To understand how disabilities affect someone’s ability to vote, it’s critical to recognize that there is a gap not only between the total number of voters with disabilities who turn out to vote versus those without disabilities, but also a gap in any turnout increases for these populations.
As Schur and Kruse note, the surge in 2018 turnout for voters with disabilities—8.5 percentage points — was 4.7 points lower than for voters without disabilities. This trend was seen across all disability types and demographics, although turnout among disability types differs.
It’s important to note here that different disabilities affect voter’s abilities to participate differently. While overall, voters with disabilities consistently have lower turnout than voters without disabilities, voters who are deaf or have serious difficulty hearing actually turn out at a higher rate than the average voter. This is likely related to the fact that hearing loss is much more common in older Americans. While seniors with disabilities have lower levels of participation than their peers, older voters are still more active than younger voters.
Looking ahead
Although the intention of the disability- or illness-related voting problems indicator is to measure the ease of voting for voters with disabilities, the wording of the question used to generate it complicates things. Because it is framed to include the respondent or a family member with a disability or illness, there’s no way to pinpoint more specifically how many nonvoters citing this reason were deterred from voting because of a disability.
The obvious long-term solution to this complication is to separate out voters with disabilities, using the disability measures already gathered by the CPS. The CPS only incorporated the measure in 2010, making this the first year where three-year averages are available. (For more details on why this is important for the EPI, take a look at the in-depth methodology for the index.)
If this solution proves more accurate — and stable enough to maintain — it could be incorporated into the EPI as a revised way to measure deterrence from voting because of a disability or illness.
There are a few other issues we keep in mind when working with data from a survey like the CPS/VRS, which we cover in the first installment of this series.
All in all, whether in its current form, or in a future variation, the disability- or illness-related voting problems indicator helps us understand the total percentage of voters who did not vote because of a disability or illness, in addition to comparing turnout alone. It helps to differentiate how much of the “disability gap” is due to disability or illness, as opposed to the many other reasons voters do not vote.
